Gamma Exposure
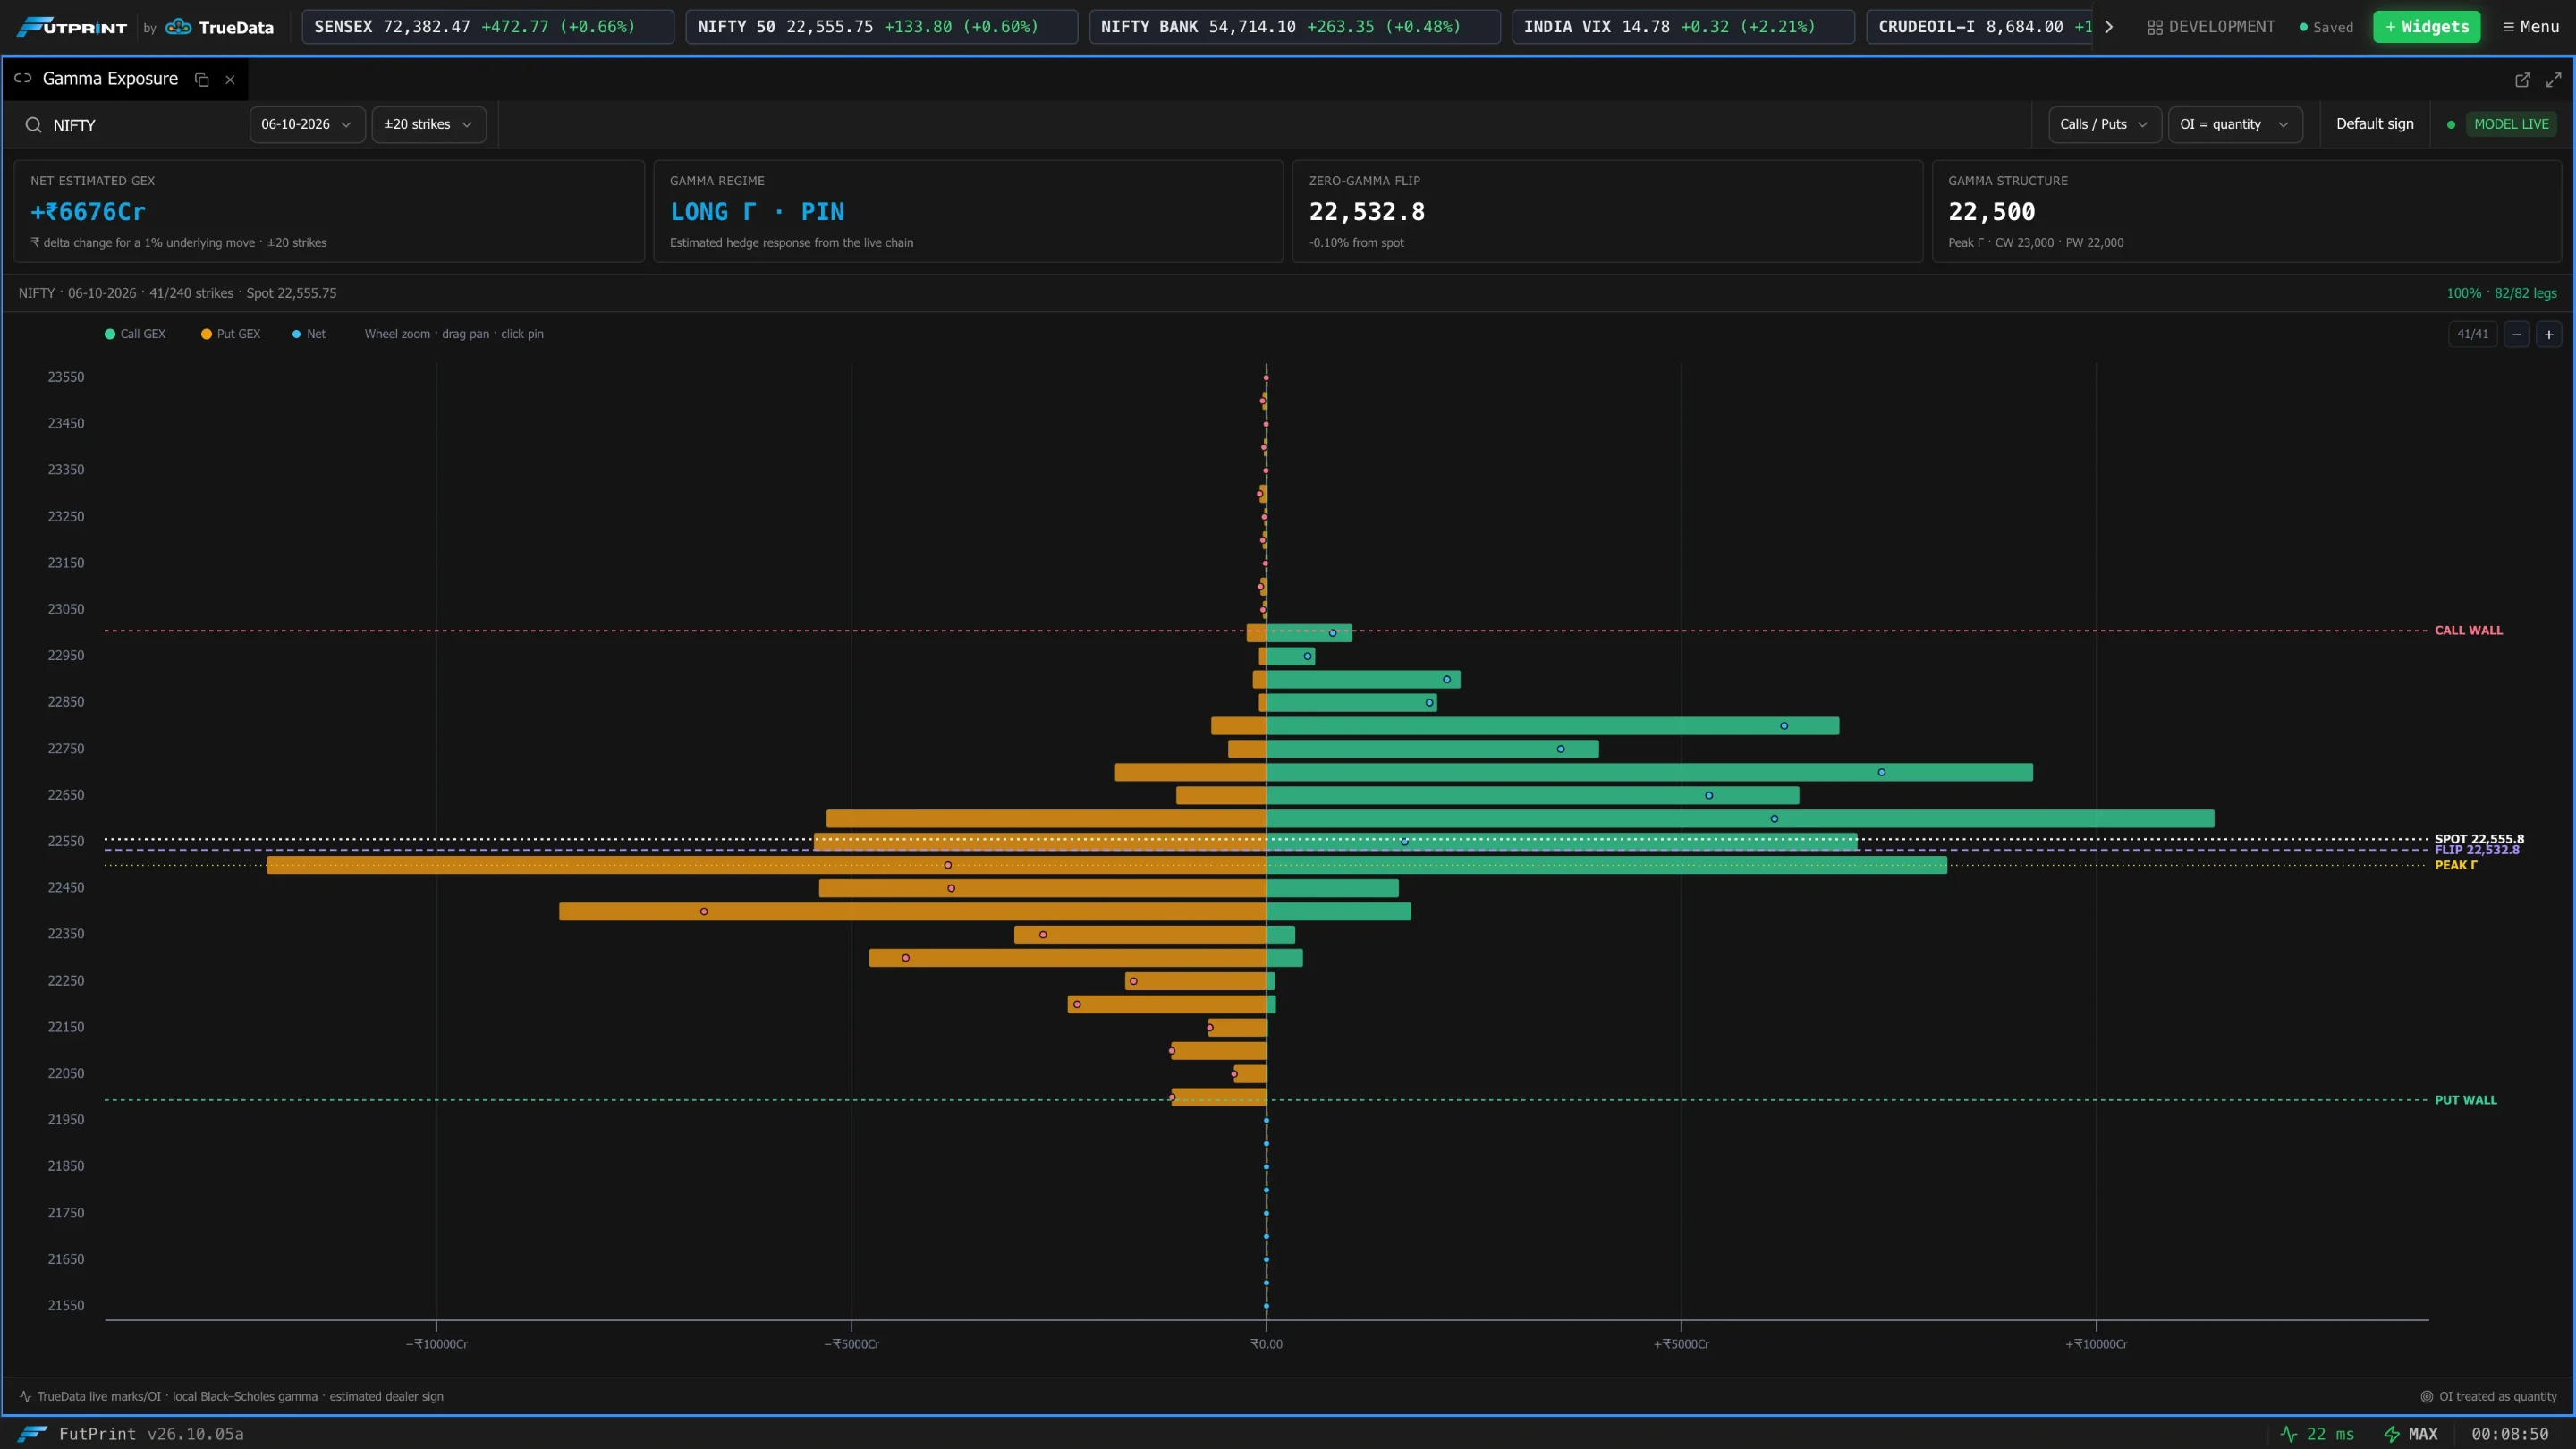
Gamma Exposure turns a live option expiry into a strike-by-strike estimate of how dealer hedging may react as the underlying moves. It shows the call, put and net gamma contribution, the estimated gamma regime, the zero-gamma flip and the largest call/put walls.
Loading a profile
- 1Choose an underlying
Search for an index or futures underlying. The widget resolves its live spot or front future automatically.
- 2Choose an expiry
The nearest upcoming expiry is selected initially. GEX is calculated separately for the expiry shown in the toolbar.
- 3Choose the strike scope
Use ±10, ±20, ±30 or Full expiry. A wider scope gives a more complete profile but subscribes to more contracts.
Reading the chart
- Call / Put view places the estimated call and put gamma contributions on opposite sides of zero. The dot is net GEX at that strike.
- Net GEX view shows one signed bar per strike. Blue is estimated long gamma; rose is estimated short gamma.
- Spot, FLIP, CALL WALL, PUT WALL and PEAK Γ lines mark the live underlying and the important levels inside the loaded scope.
The chart is interactive:
- Hover a strike to highlight it and inspect call/put GEX, net GEX, marks, OI, OI change, implied volatility and gamma.
- Use the mouse wheel over the chart to zoom around the cursor. Drag vertically, use a horizontal trackpad gesture or hold Shift while scrolling to pan a zoomed chart.
- Click a strike to pin its tooltip. Click it again or press Escape to clear the pin.
- Use +, − and Fit in the top-right corner, or double-click the chart, to control and reset the visible strike range.
The four summary cards show net estimated GEX, the gamma regime, the nearest zero-gamma crossing and the peak/wall structure. GEX is expressed as the estimated rupee delta change for a 1% move in the underlying.
Data quality
The coverage badge reports how many option legs have both a usable mark and open interest. Flip and wall overlays remain hidden until at least 60% of the loaded legs are populated. During market hours the chart uses bid/ask midpoint when available and falls back to LTP. If that snapshot is unavailable—or the market is closed—the widget hydrates the latest completed TrueData OHLC/OI session and labels the result Previous session. Gamma and implied volatility are solved locally in both modes.
The OI units selector is deliberate:
- OI = quantity is the normal setting when the feed already reports exchange quantity. Lot size is not multiplied again.
- OI = contracts multiplies the incoming OI by the contract lot size.
Open interest does not identify which side dealers hold. FutPrint uses the common call-positive / put-negative sign convention, which you can invert from the toolbar. Long gamma describes a potentially stabilising hedge response and short gamma an accelerating response; neither is inherently bullish or bearish.
What's saved
The underlying, expiry, strike scope, chart view, OI-unit interpretation, sign convention and model rates are saved with the workspace. Gamma Exposure also participates in symbol link groups and can be cloned like other panels.