Chart — Overview
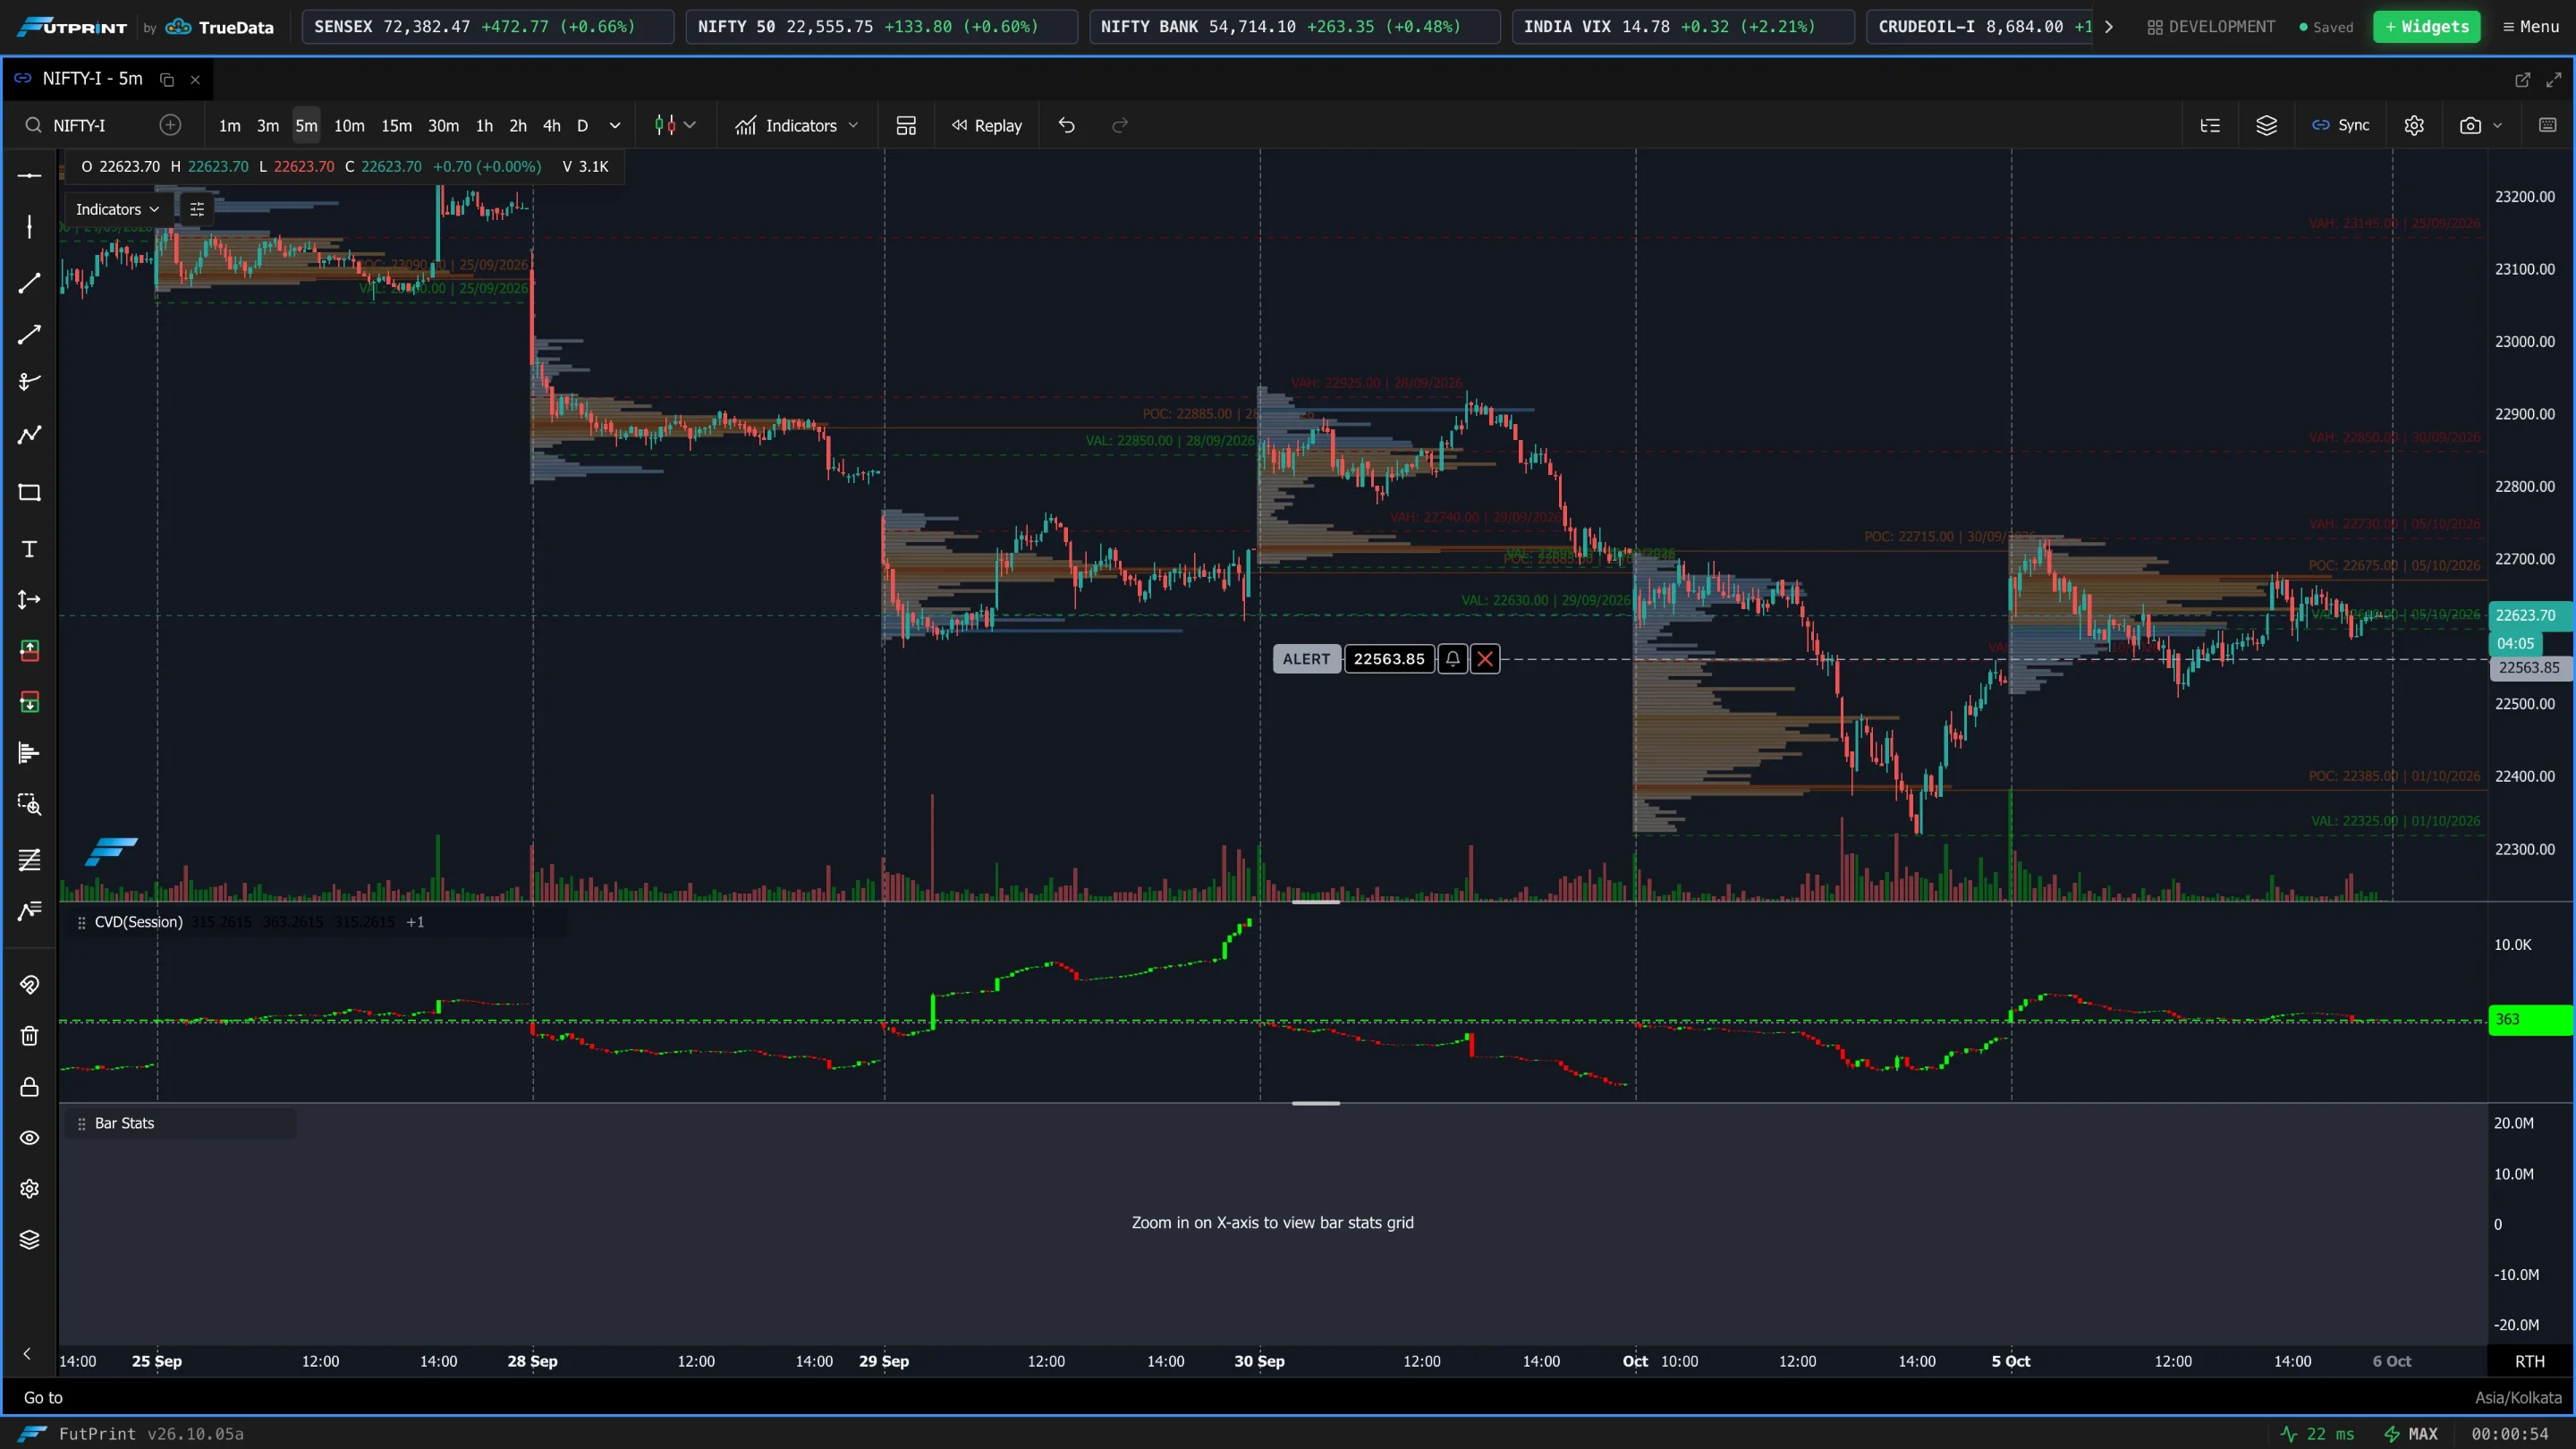
The Chart is the deepest module in FutPrint. It draws live price action in a range of chart types, on any timeframe, and layers on drawing tools, technical indicators, order-flow views and a full replay engine. You can run many charts at once and link them so they move together.
How the Chart docs are organised
Because there's so much here, the Chart is split into focused pages:
| Page | What it covers |
|---|---|
| Interface & Toolbar | Every button in the header toolbar and the drawing rail; the crosshair and info readout. |
| Symbol & Timeframes | Changing the instrument, picking timeframes, and tick-based bars. |
| Chart Types & Modes | Candlestick, OHLC, Line, Area, Heiken Ashi, TPO, Clusters (footprint), Tick Range/Number. |
| Drawing Tools | Trend lines, channels, Fibonacci, positions, VWAP, volume profile, text and more. |
| Technical Indicators | The full indicator catalogue, by category, and how to add/configure them. |
| Chart Settings | Appearance, scales, grid, trading and per-type options. |
| Replay Mode | Step through history bar-by-bar to study or practise. |
| Keyboard Shortcuts | Speed up everything above. |
What a chart remembers
Each chart saves its own state into your workspace — so it reopens exactly as you left it:
- the symbol and timeframe
- the chart type and its type-specific settings
- every indicator and its inputs
- every drawing you've placed
- the viewport (zoom/scroll) and sync settings
Linking charts
Charts (and other modules) can be put in a link group. Selecting a symbol in one linked panel updates the others, so a watchlist, chart and option chain can all follow the same instrument. You can also choose what syncs between linked charts — crosshair, indicators and/or drawings — from the Sync menu in the toolbar.
If you're new to the Chart, read Interface & Toolbar next, then Chart Types. Drawings and indicators build on those.