Chart — Interface & Toolbar
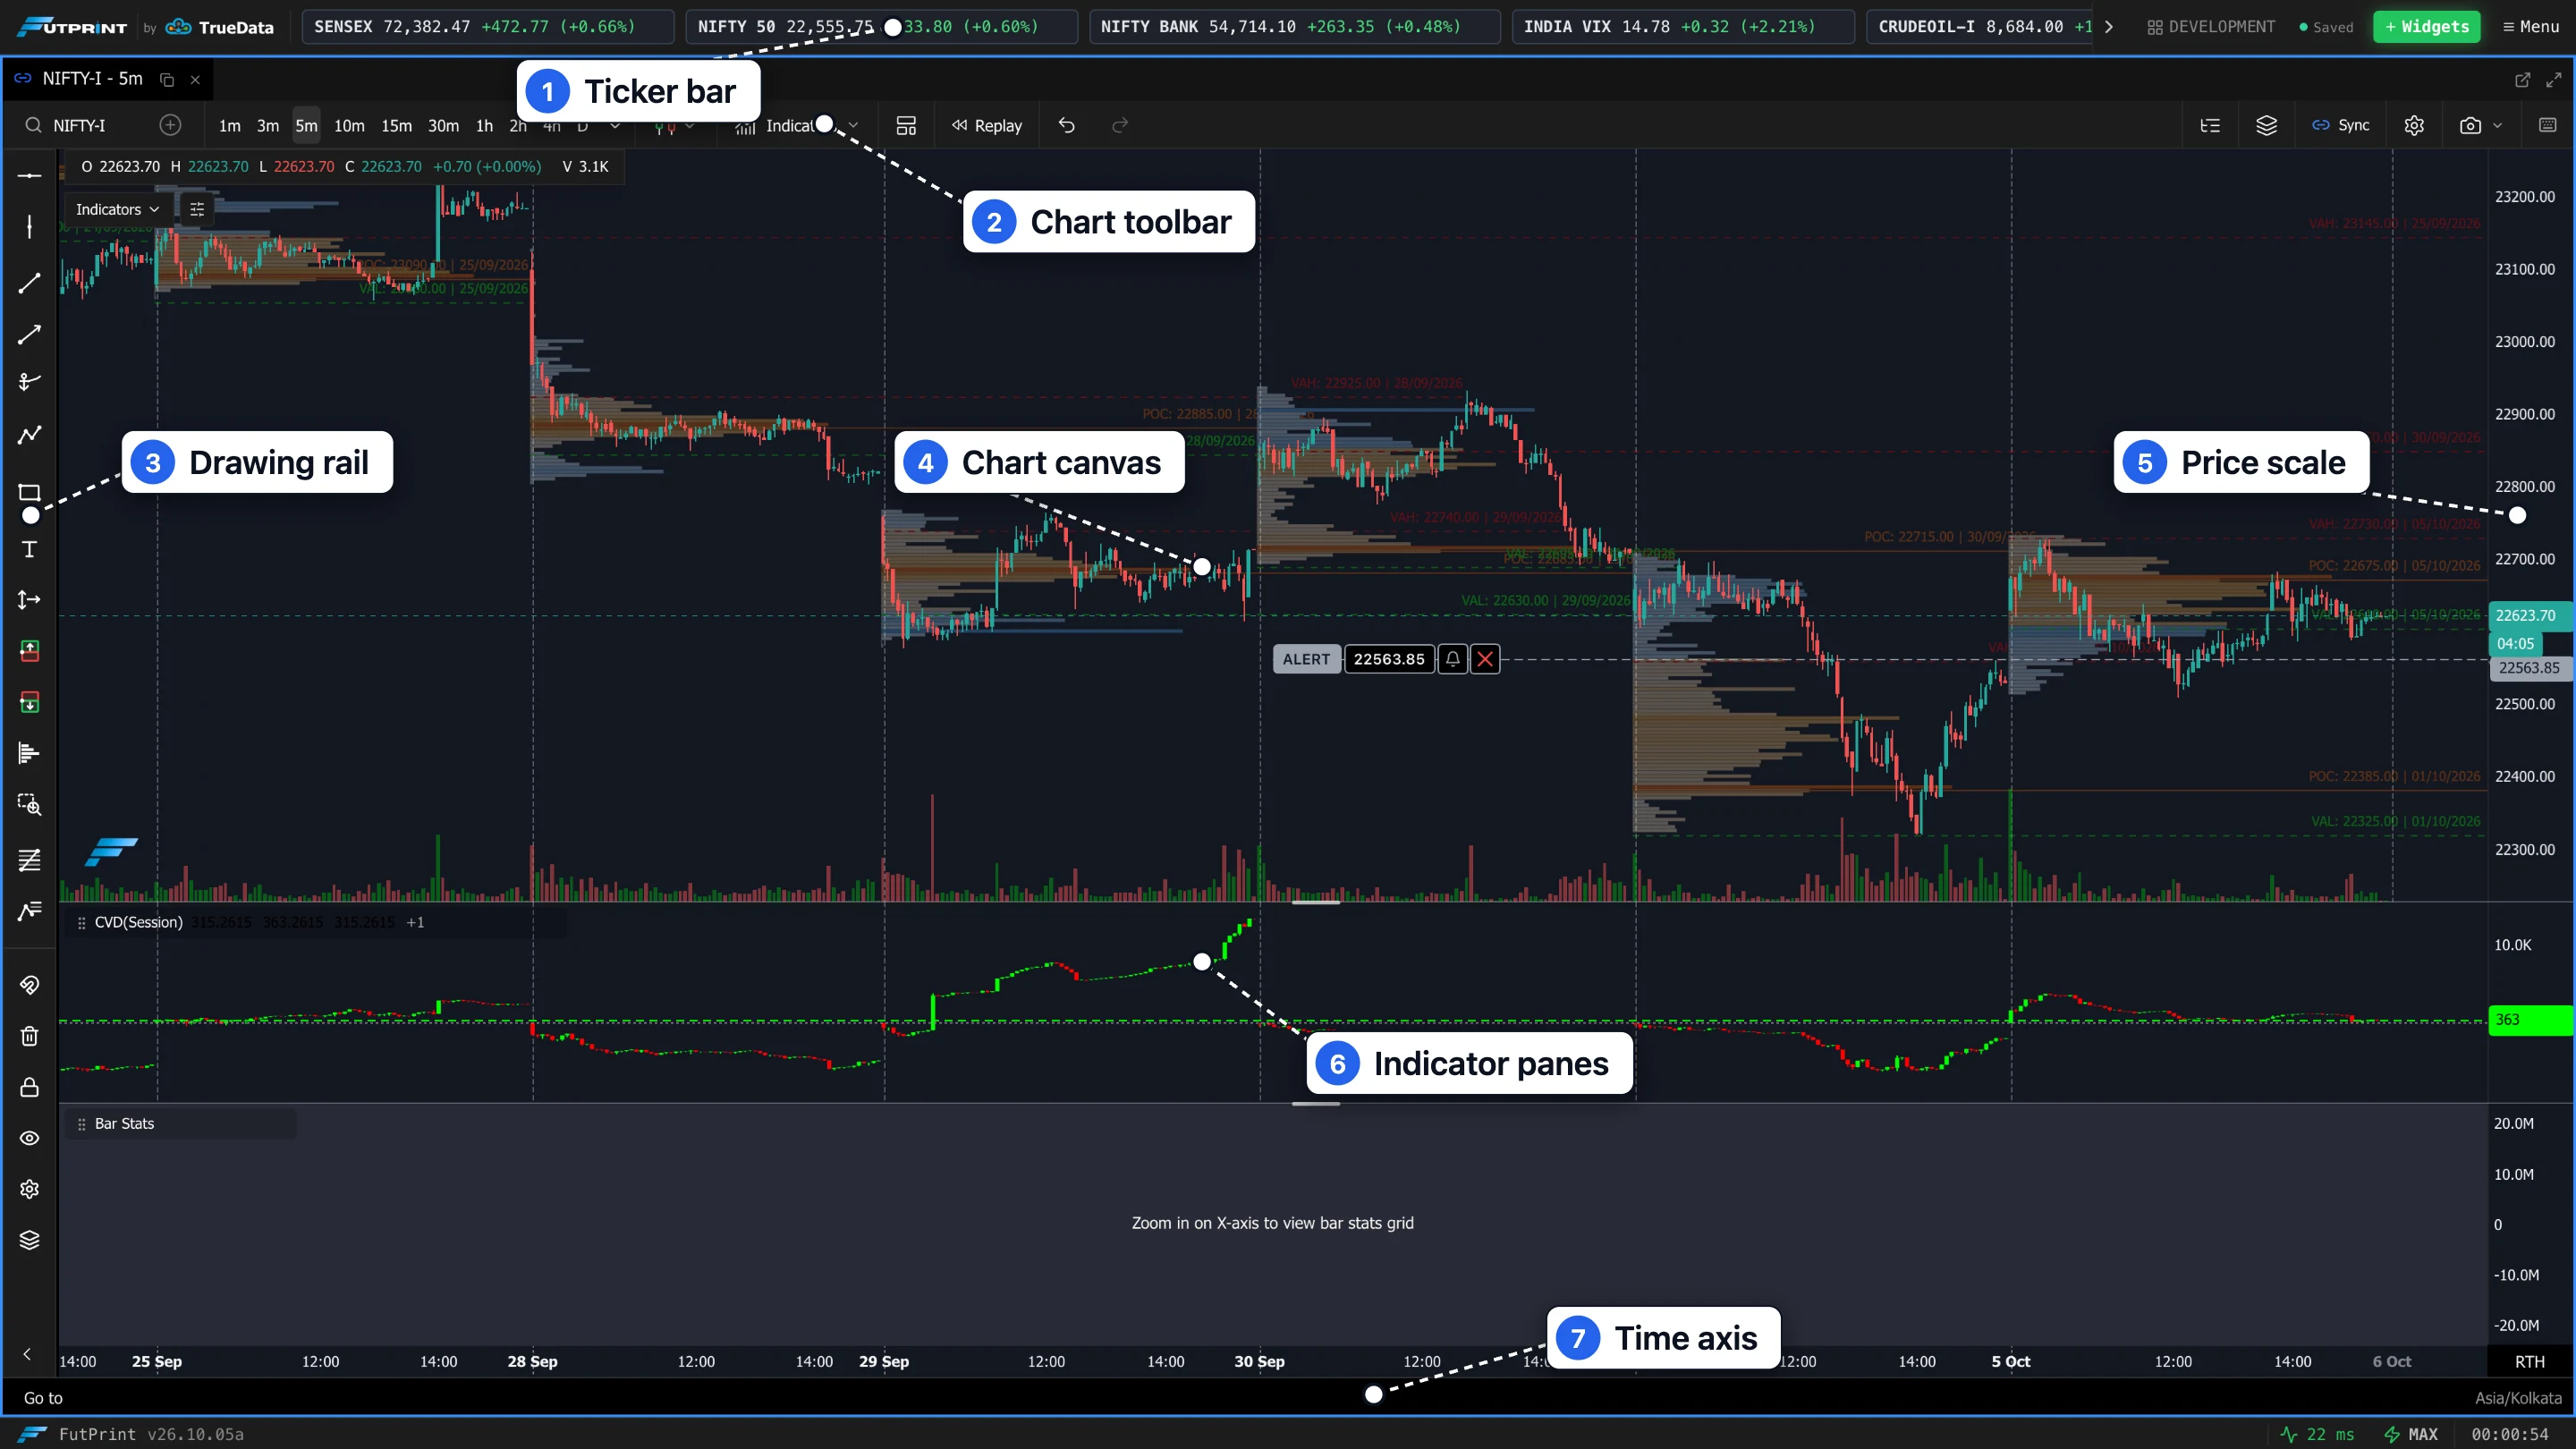
A chart has three interactive zones: the header toolbar along the top, the drawing rail down the side, and the chart canvas itself (with its price and time axes and the crosshair).
The header toolbar
Left to right, the header toolbar gives you:
| Control | What it does |
|---|---|
| Symbol | The instrument on the chart. Change it to load a different stock, index, future or option. See Symbol & Timeframes. |
| Timeframe | Quick intervals from 1m to D, with the adjacent menu for weekly/monthly intervals and Custom…. |
| Chart Mode | The chart type: Candlesticks, OHLC, Line, Area, Clusters, Heiken Ashi, TPO, Tick Range, Tick Number. See Chart Types. |
| Tick Range / Tick Count | Numeric inputs that appear when a tick-based mode is selected. |
| Indicators | Opens the indicator browser to add technical studies. See Indicators. |
| Settings | Opens chart settings (appearance, scales, grid, trading…). See Chart Settings. |
| Capture chart | Download the chart as PNG or SVG, copy the PNG image to the clipboard, or download loaded chart data as CSV. CSV includes only revealed bars during replay. |
| Data | Open the movable, resizable Data inspector for candle prices, order-flow data, and indicator readings. |
| Undo / Redo | Restore drawing edits, indicator additions/removals/settings, chart appearance/type, comparison choices, and pane sizes. |
| Compare icon (⊕) | Add up to four instruments using a shared percentage scale on time-based price charts. |
| Layer Manager | Shows the stack of layers (price, indicators, drawings) so you can manage what's drawn and in what order. |
| Templates Manager | Save the current chart setup (type, indicators, styling) as a template and apply it to other charts. |
| Sync | For linked charts: toggle whether Crosshair, Indicators and Drawings sync across the link group. |
| Keyboard Shortcuts (?) | Opens the shortcut reference. See Keyboard Shortcuts. |
Image exports redraw the chart and indicator panels at up to 4× resolution, including the price and time axes. They use the chart background without an outer frame, header, or footer; crosshairs and drawing handles are omitted. Very large charts use a lower scale to stay within image size limits. PNG downloads and clipboard copies use the same image.
The SVG download preserves that high-resolution chart as an embedded image. It is a standalone SVG file, but its chart artwork is not editable vector paths.
Data inspector
Open Data beside Layers. The inspector follows the crosshair, including linked charts, and returns to the latest candle when you leave the chart. Moving into the inspector holds the last inspected candle so you can select text or pin it. Drag its title bar to move it; drag its lower-right corner to resize it.
Use Pin candle to keep inspecting a candle while moving around the chart. The arrow buttons (or Left/Right with the inspector focused) step through loaded candles. Copy candle readings copies the timestamp, prices, order-flow values, and indicator readings. Escape closes the inspector.
Prices use the chart's precision and timezone. Real zero values remain zero; missing readings show Unavailable. Order-flow readings use available bid/ask data and verified delta extremes, without estimating missing values. Custom-script readings use their plot names, formatting, and display offsets. Indicators without per-candle outputs say so. Replay limits inspection to revealed bars; a pinned candle outside that history remains unavailable until revealed again or unpinned. Changing the instrument or interval clears the pin.
If the chart is narrow, the toolbar scrolls — use the ‹ › arrows at its ends to reach controls that are off-screen.
Undo and redo
Use the arrows immediately after Capture chart, Ctrl/⌘ Z, Ctrl/⌘ Shift Z, or Ctrl Y. Rapid edits to one setting combine into a single step. History holds the latest 100 edits in this chart, including symbol and interval changes. Undoing a symbol change returns to its drawings and indicator configuration; redo moves forward through the same actions. Controls pause briefly while a requested chart selection is applied. Restoring a workspace/template or replacing the chart clears history. Live prices and indicator calculations never create undo steps. Broker orders, positions, and alerts use their own controls and are not undone here. Panning, zooming, and Layer Manager group/opacity changes are outside this history.
Reading crowded charts
Double-click an indicator pane's title, or hover the title and choose Maximize pane, to fill the chart with that pane. Choose Restore panes or press Escape to restore the previous pane sizes. Price tags move apart when they collide; small connectors identify their actual price levels. Tags outside the visible range, or excess tags that cannot fit, are omitted. Their values remain available in the Data inspector.
Comparing instruments
Choose the Compare icon (⊕) beside the symbol selector, then search for another instrument. The chart temporarily uses a percentage axis with the first visible candle shared by all visible instruments as its zero point. Equal percentage changes have equal vertical distances. Panning changes this common starting candle. Automatic scaling includes comparison moves; a manually adjusted price range remains yours to control.
The comparison strip shows each instrument's change at the crosshair (or the latest visible candle). Use its color swatch, eye, and remove buttons to customize it. Settings save with the chart and can be undone. Removing or hiding every comparison restores your usual price scale. Raw prices remain in the Data inspector.
Comparisons use the chart's interval and trading session. Lines connect available prices across missing candles and session breaks; missing readings remain unavailable in the data inspector and exports. No common starting bar means the visible histories cannot share a baseline. Historical candles refresh every five seconds while the chart is active. Replay uses only revealed timestamps and withholds the forming candle's completed comparison close. Tick, Renko, Kagi, point-and-figure, and stacked TPO charts do not support comparisons.
The drawing rail
The drawing tools live on a rail beside the canvas. Pick a tool, then click on the chart to place it. Tools are grouped by purpose — lines and channels, Fibonacci, trade/position tools, VWAP and volume profile, and text. The full catalogue and how each behaves is on the Drawing Tools page.

The canvas, axes and crosshair
- Pan: drag the canvas left/right to move through time; drag the axes to scale.
- Zoom: scroll to zoom; the price (Y) and time (X) axes can be scaled independently by dragging them.
- Crosshair: as you move the pointer, a crosshair tracks the bar under it and the axes show the exact price and time at the cursor. An info readout shows the OHLC (and volume) of the bar you're hovering.
- Reset view: fit the data back into view from the keyboard or by double-clicking an axis (see Shortcuts).
/help-assets/chart/pan-zoom-crosshair.mp4Right-click menu
Right-clicking the canvas opens a context menu with quick actions for the chart and for whatever is under the cursor (for example, editing or deleting a drawing, or acting on a price level).