Chart — Footprint / Cluster Settings
When the chart is in Clusters (Footprint) mode, a Footprint tab appears in Chart Settings with the complete order-flow configuration. This page documents every option, grouped exactly as the tab presents them.
A footprint breaks each candle into its individual price levels and shows the volume (or trades) that happened at each level, split by side. These settings control how those levels are binned, what data each column shows, how it's coloured, and which order-flow signals (POC, value area, imbalances, Big Trades, divergence) are drawn on top.
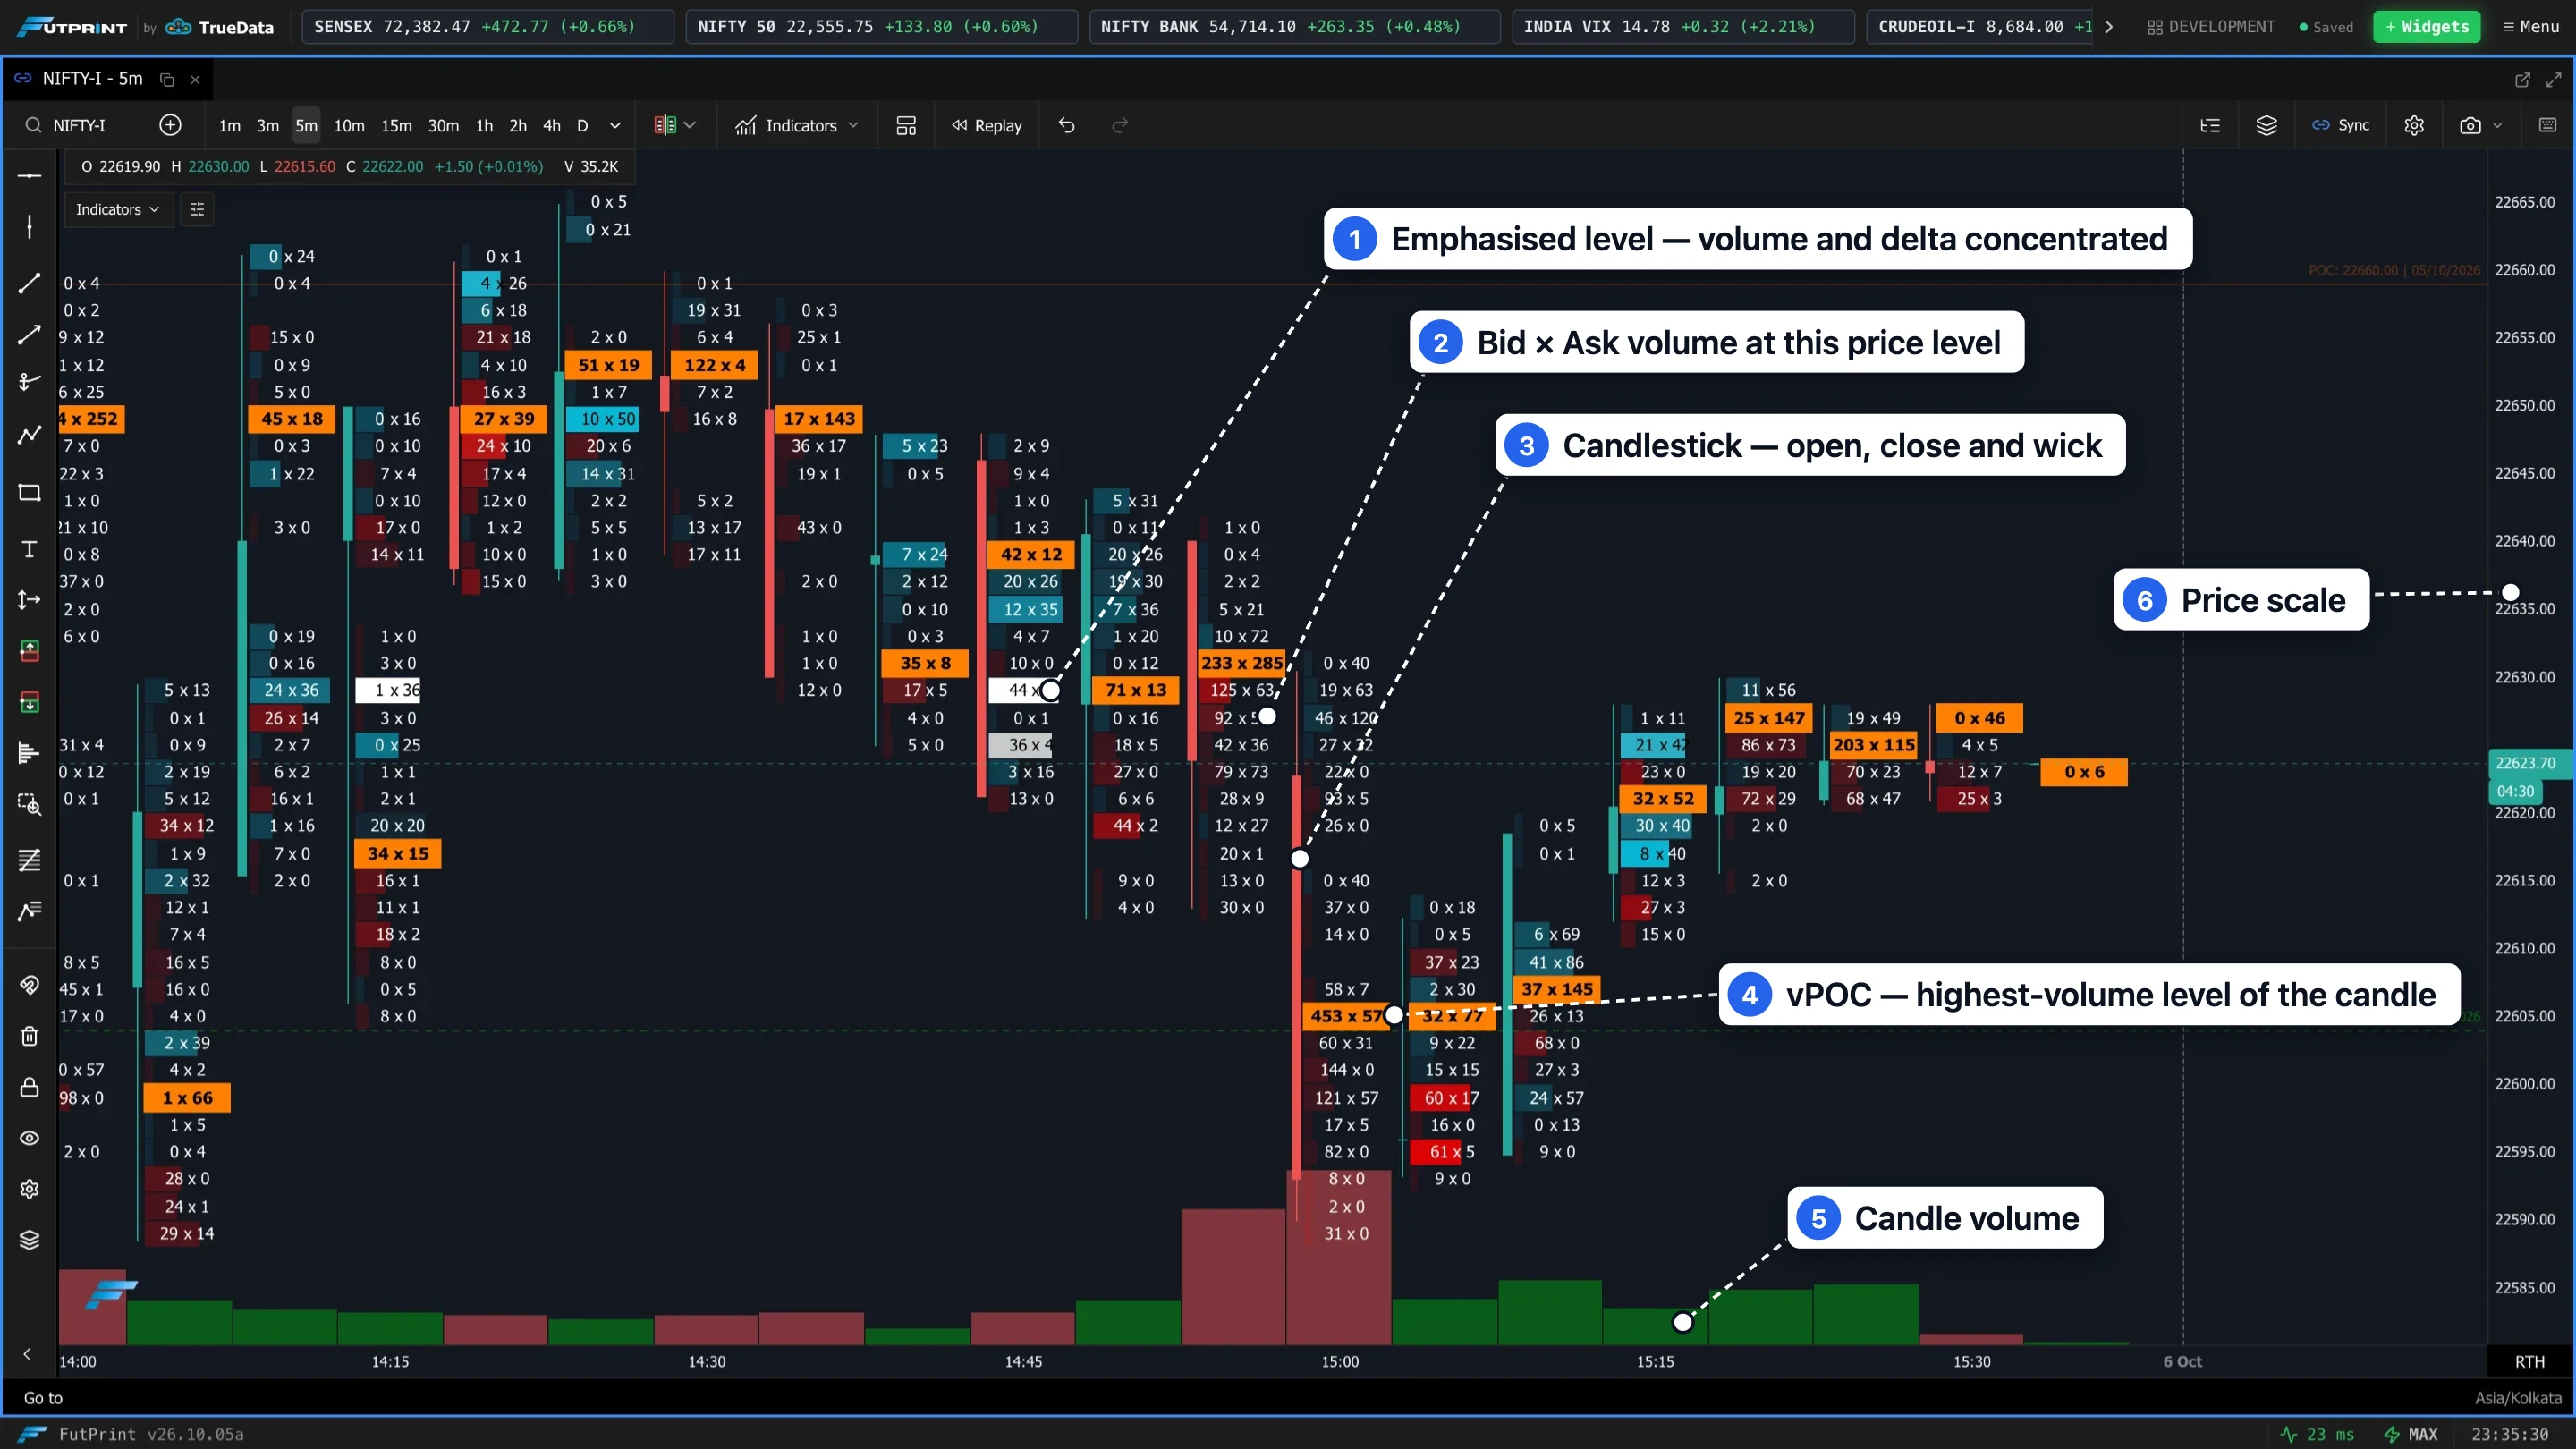
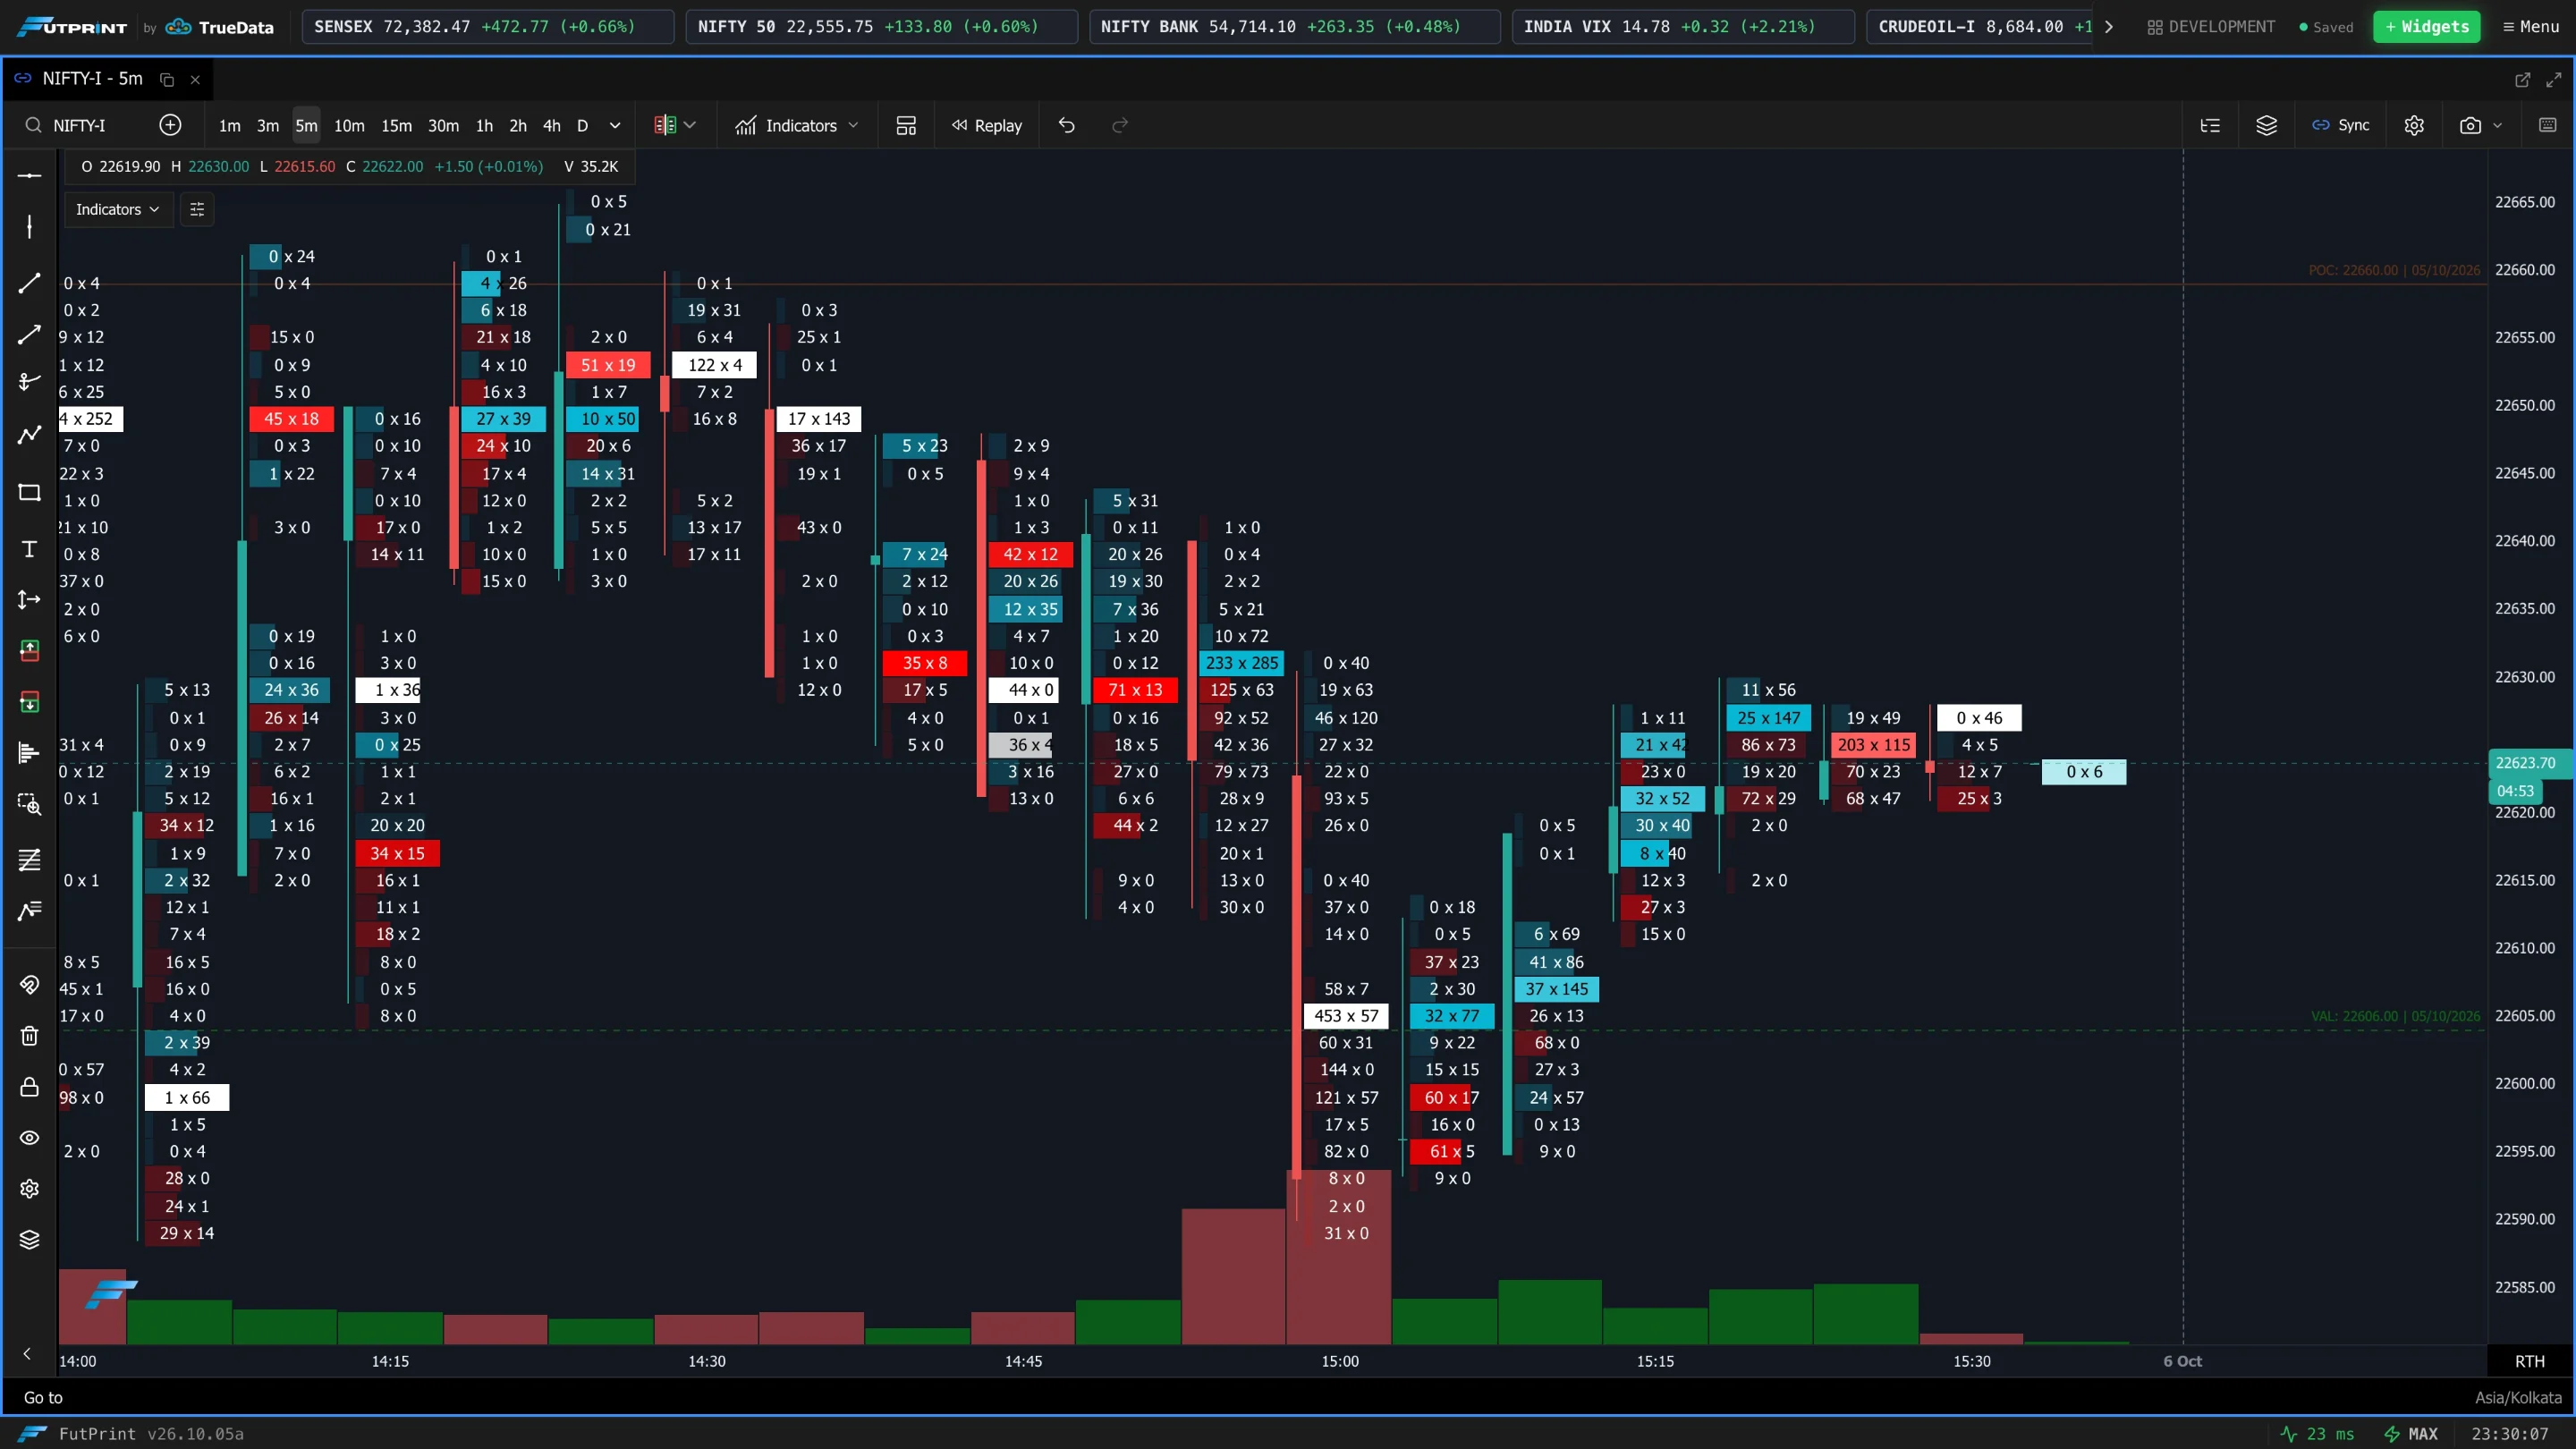
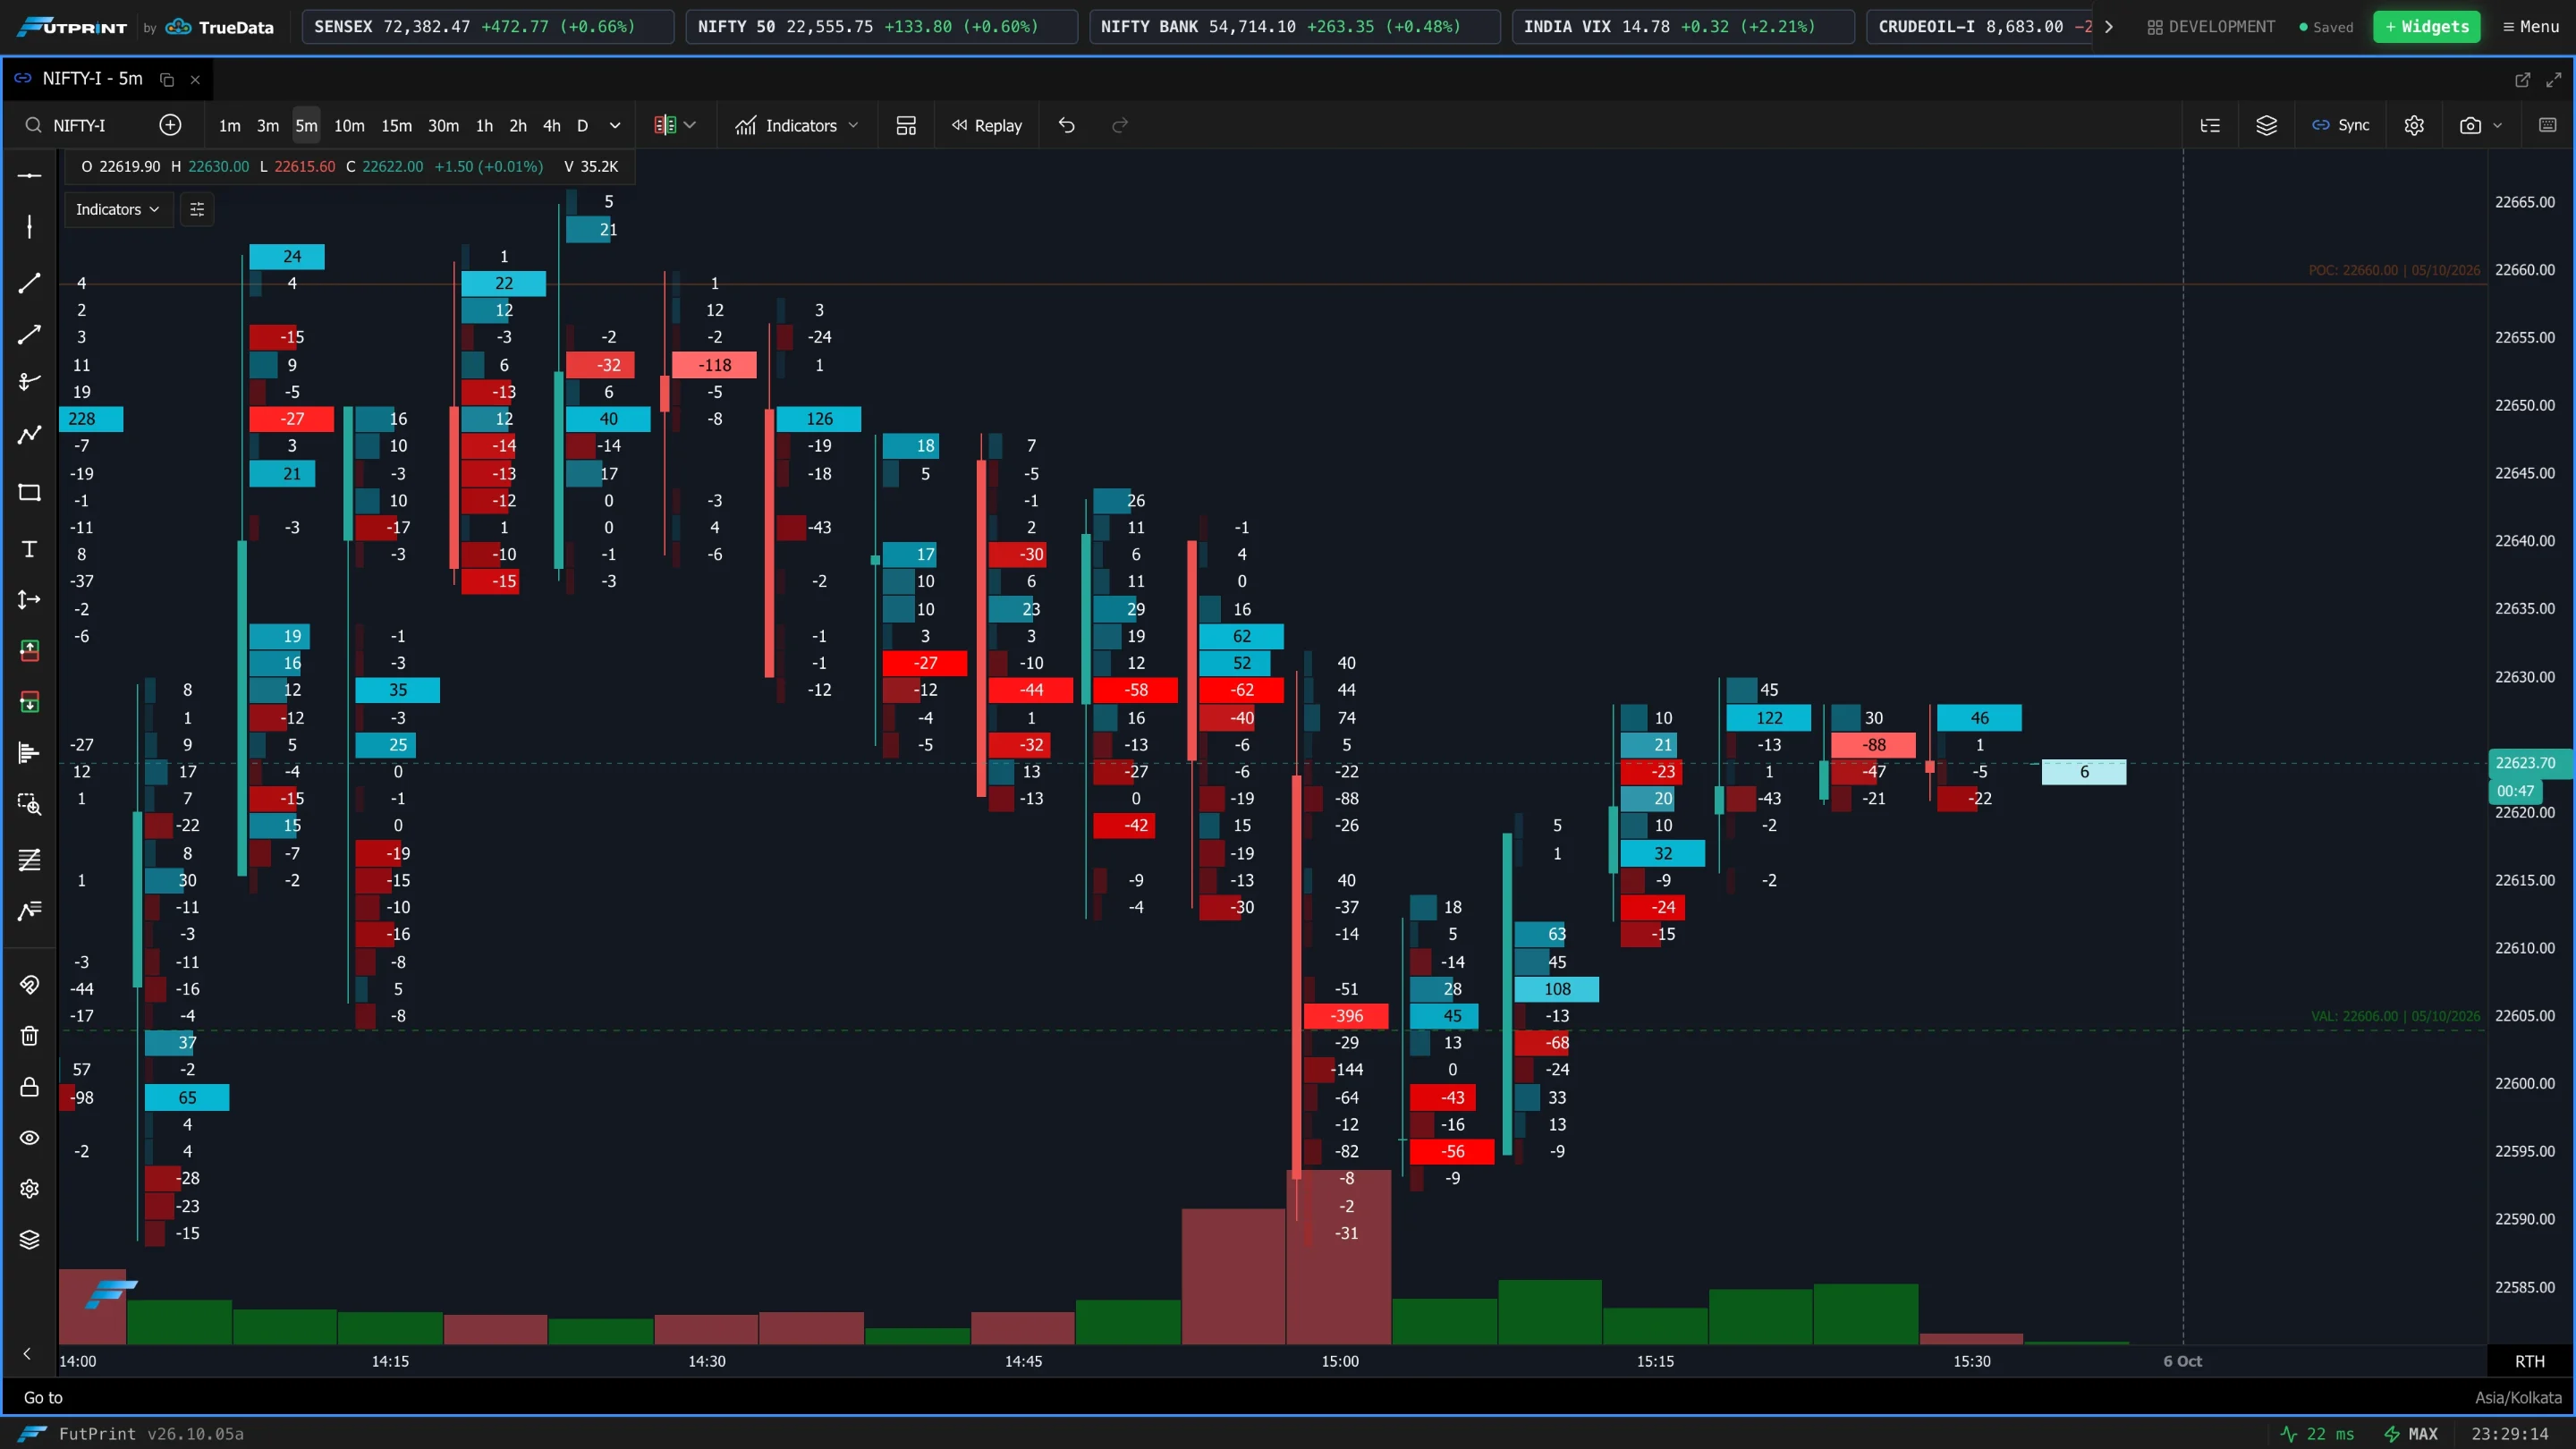
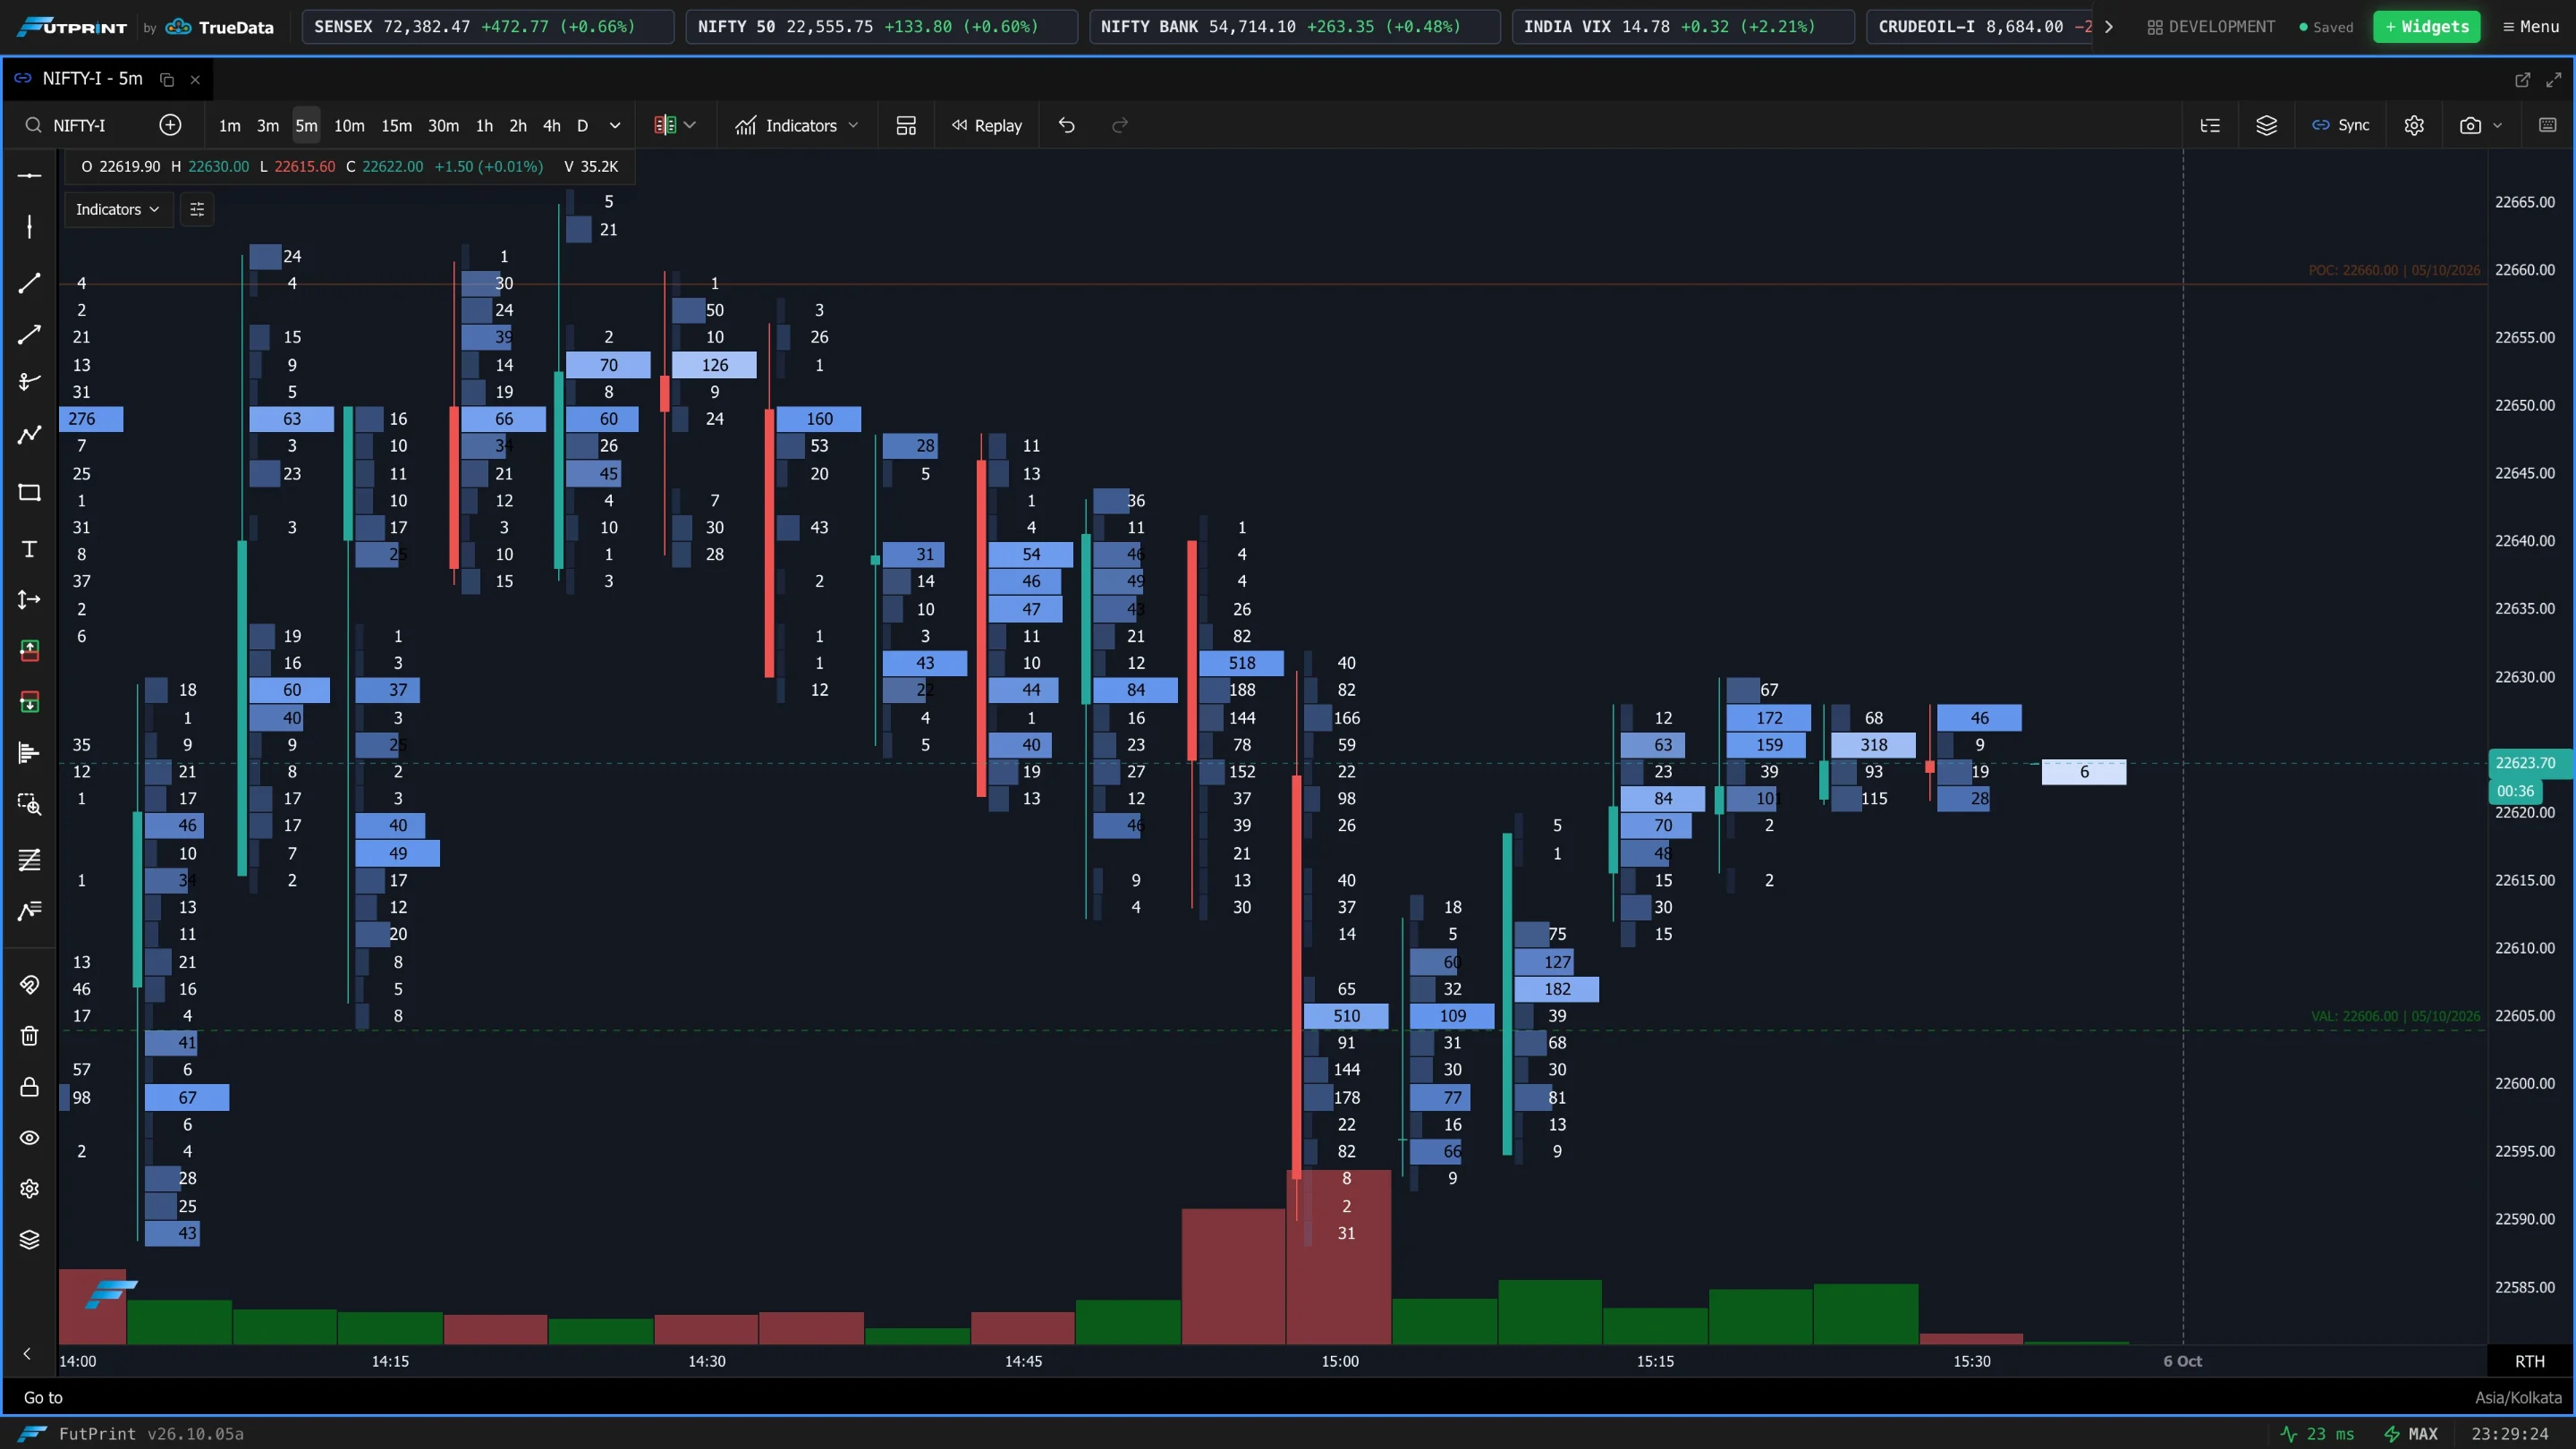
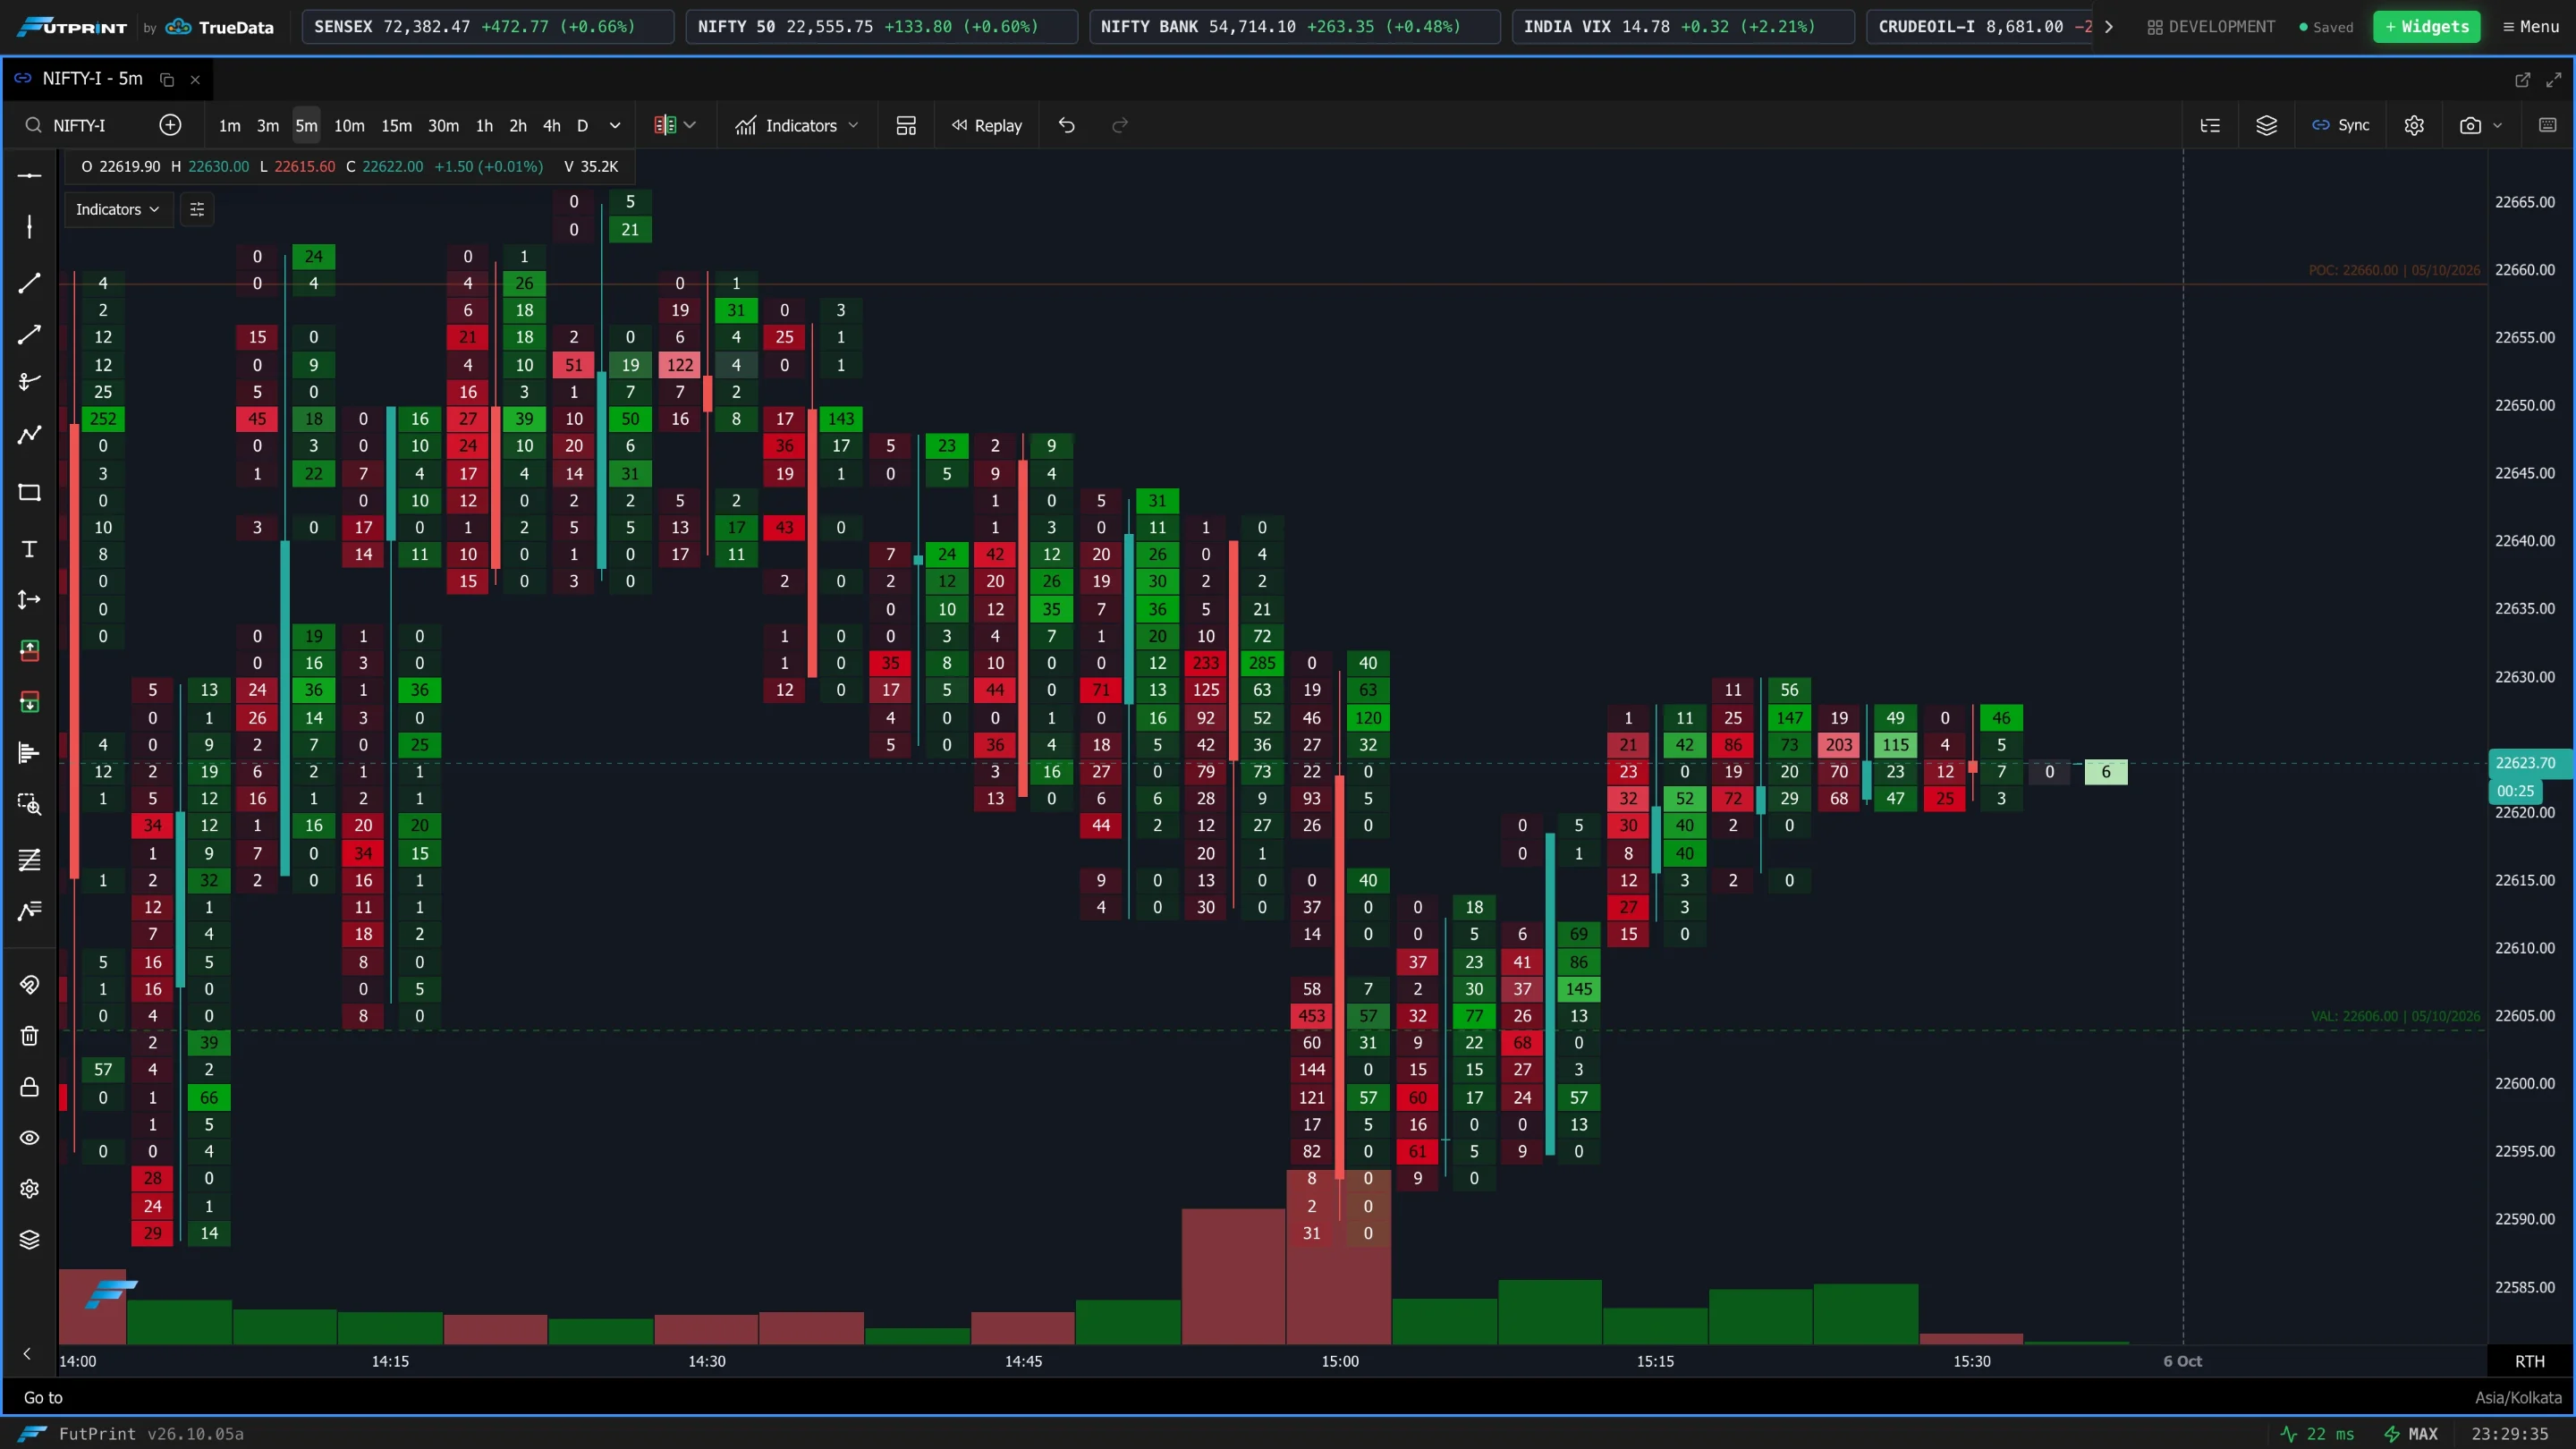
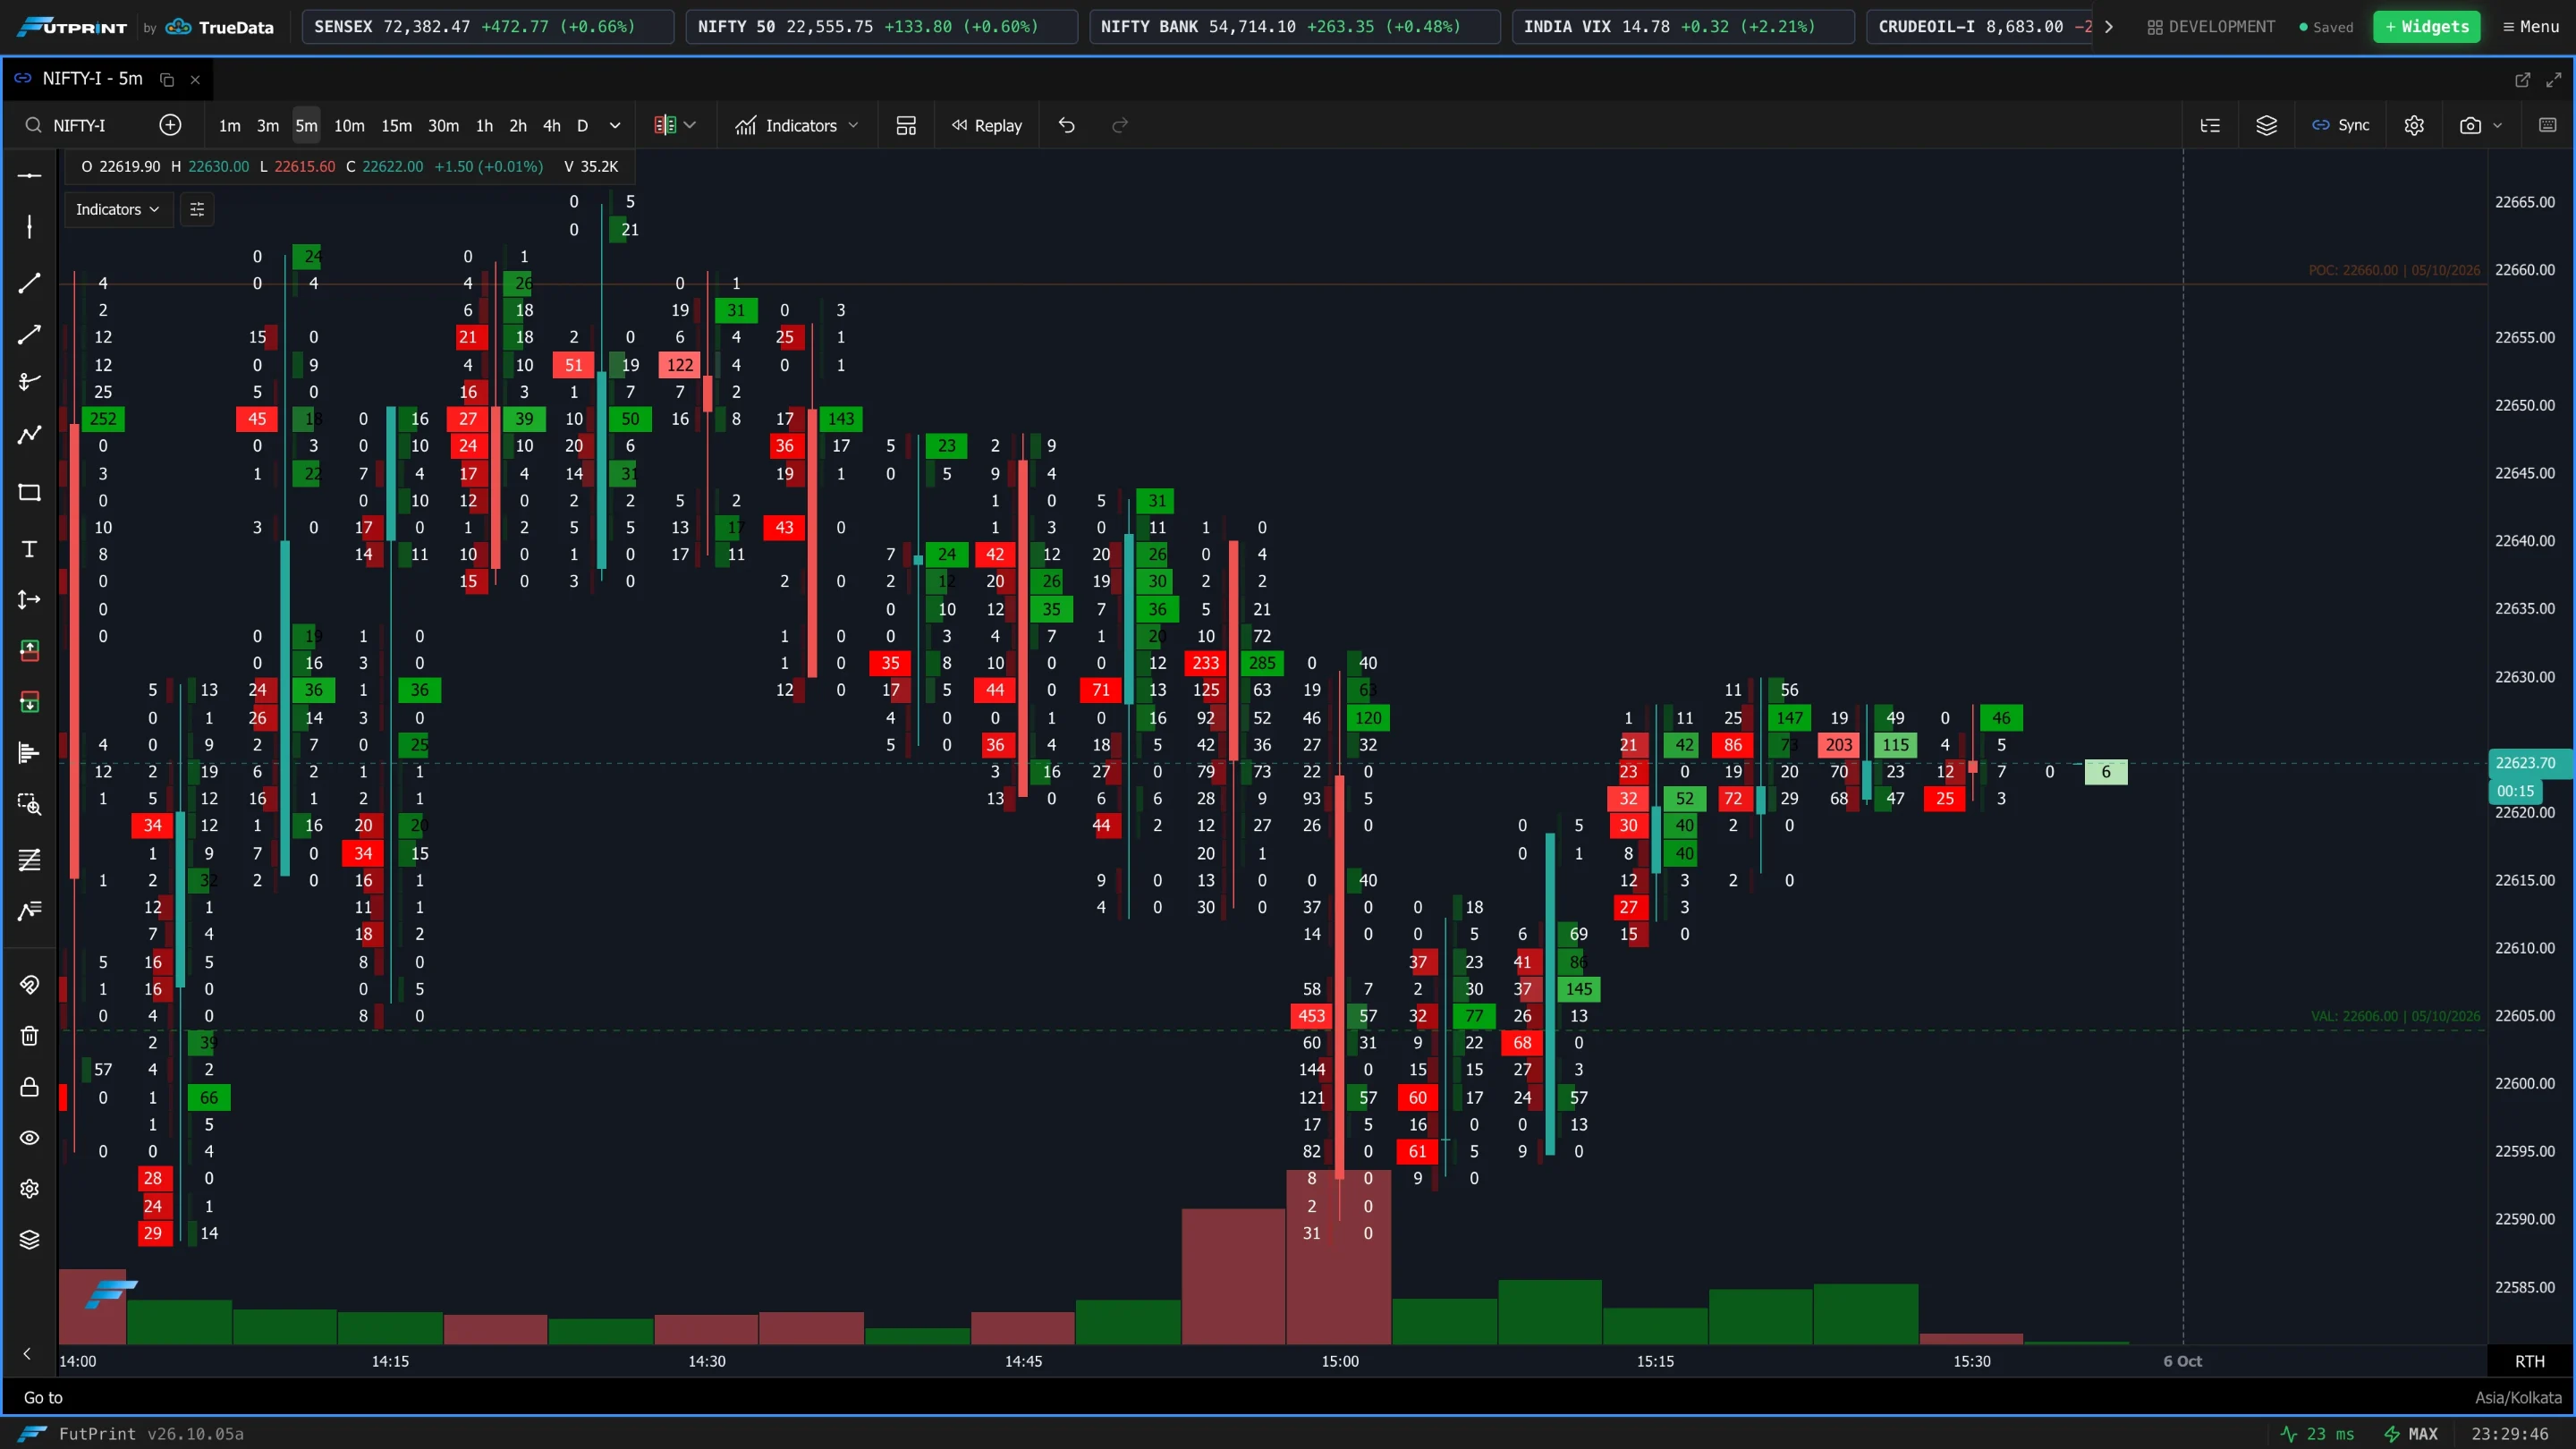
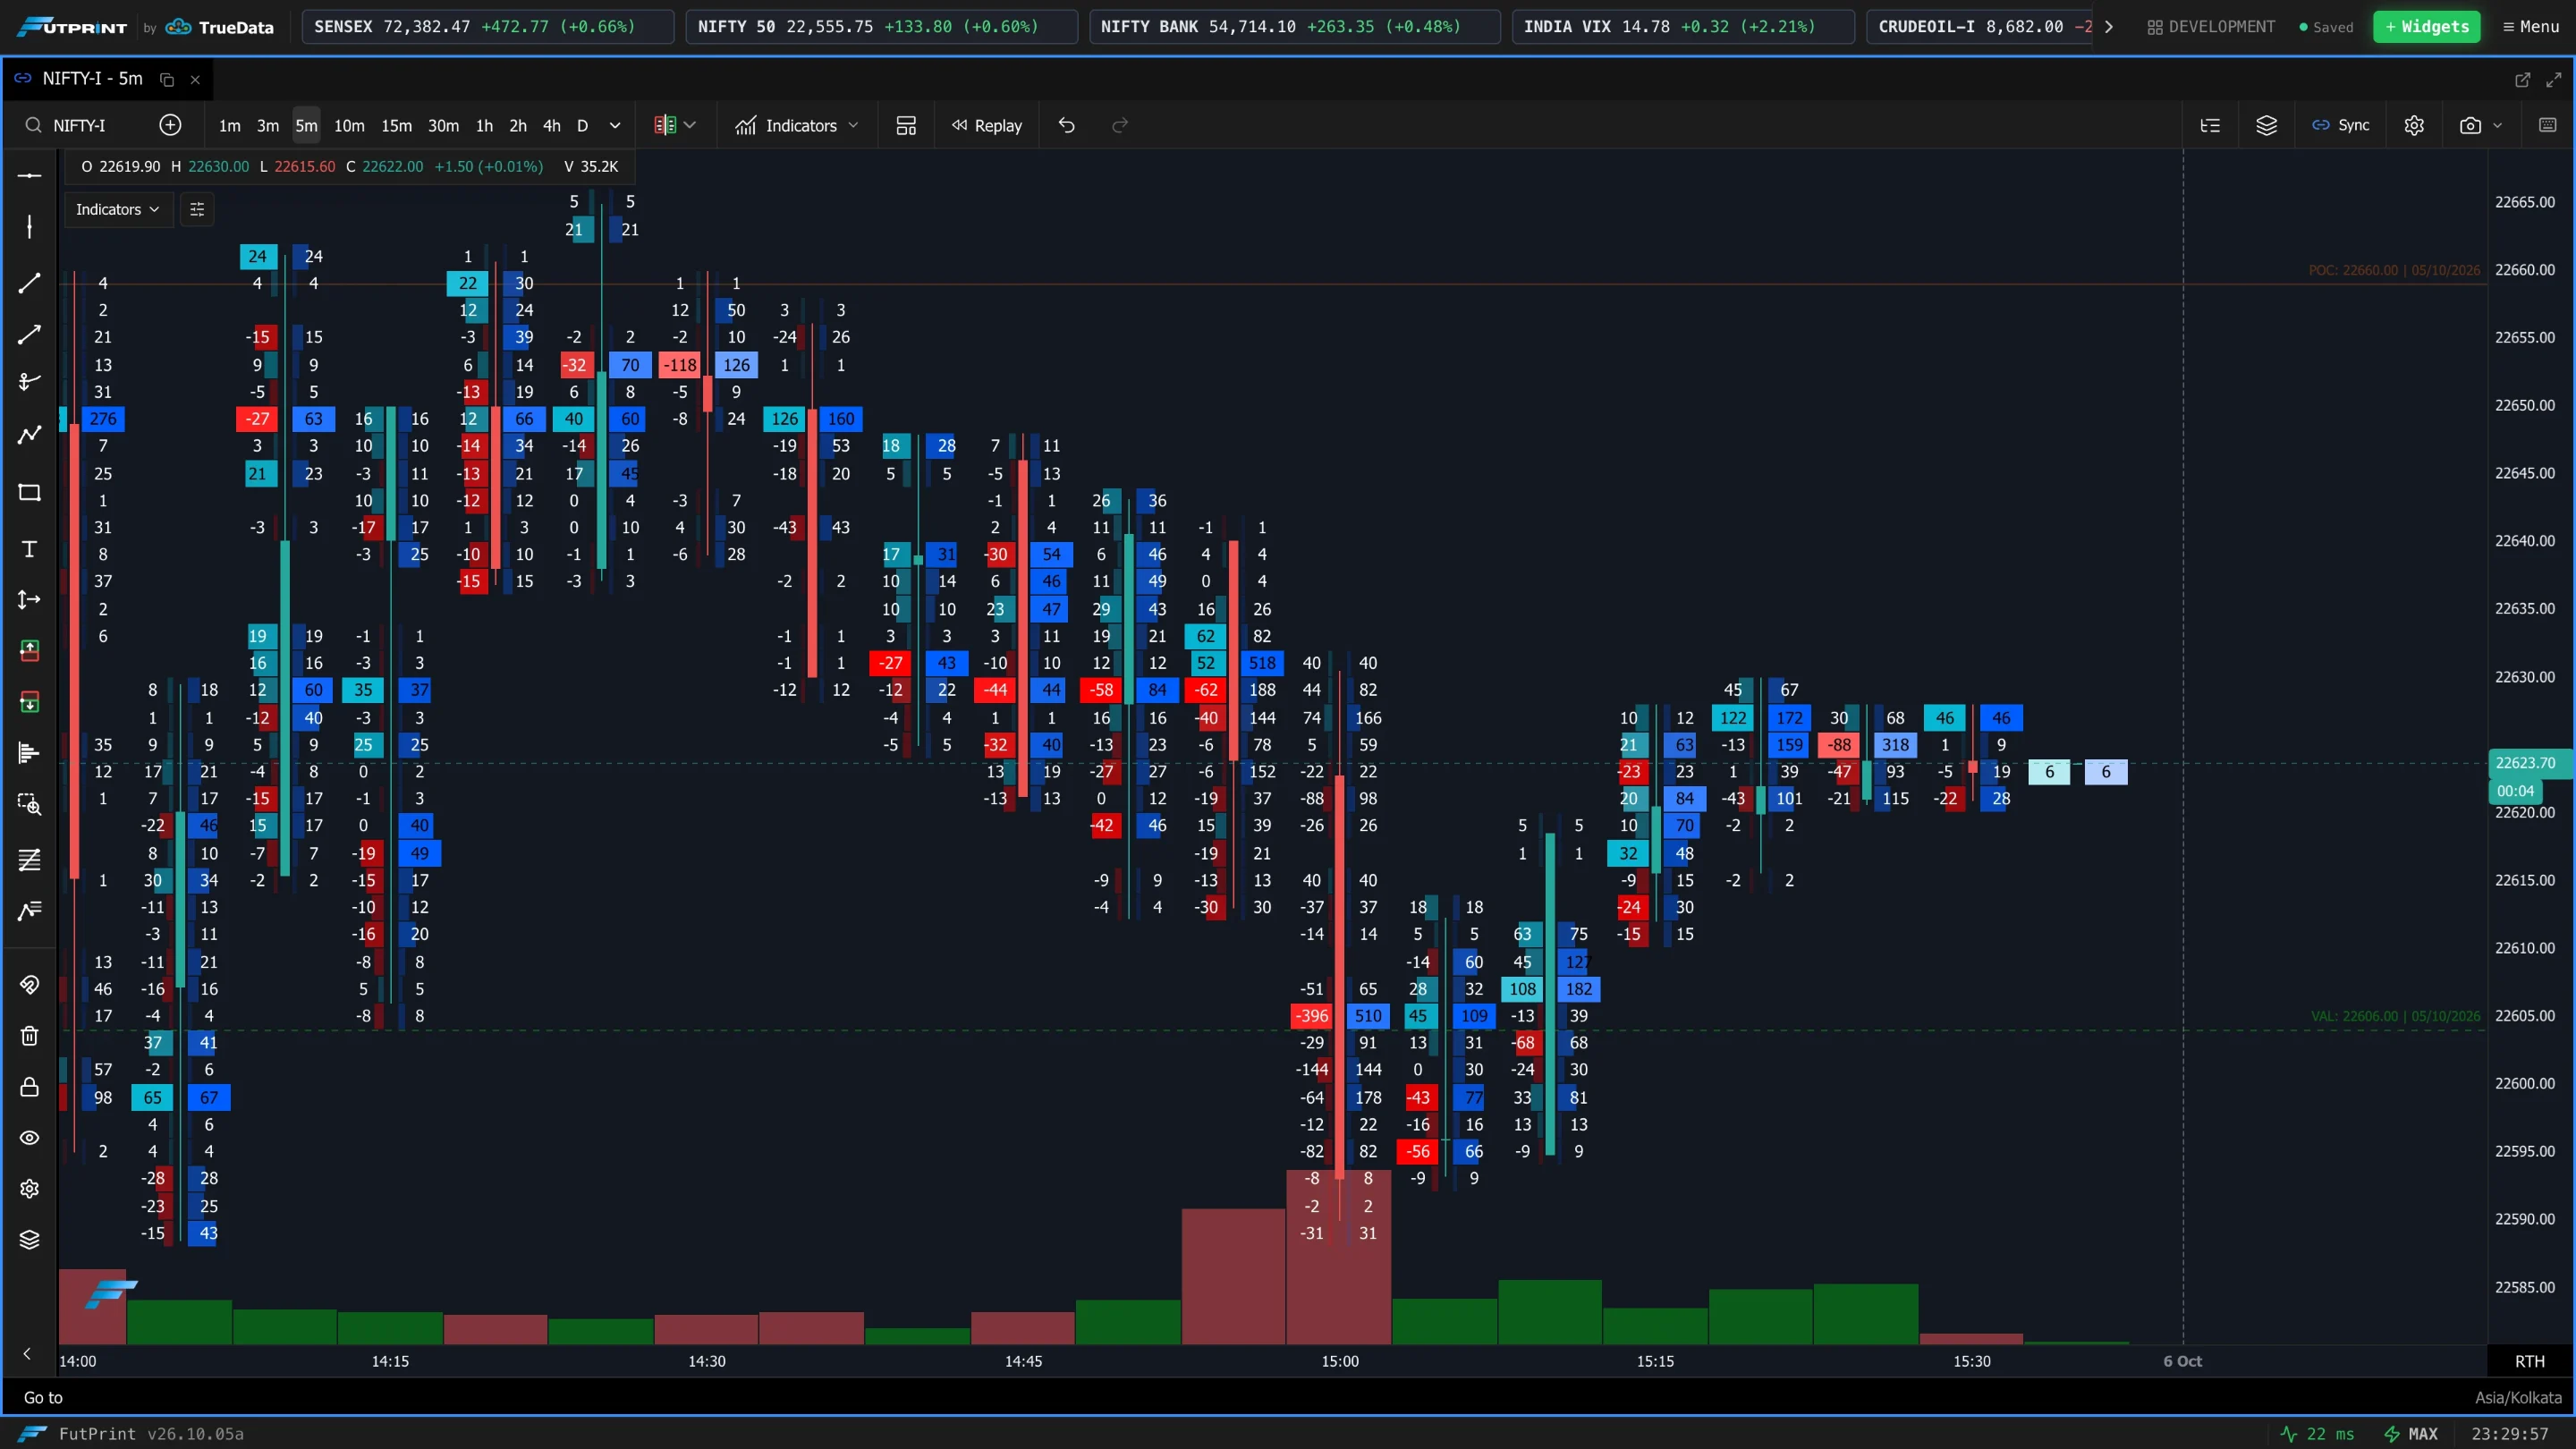
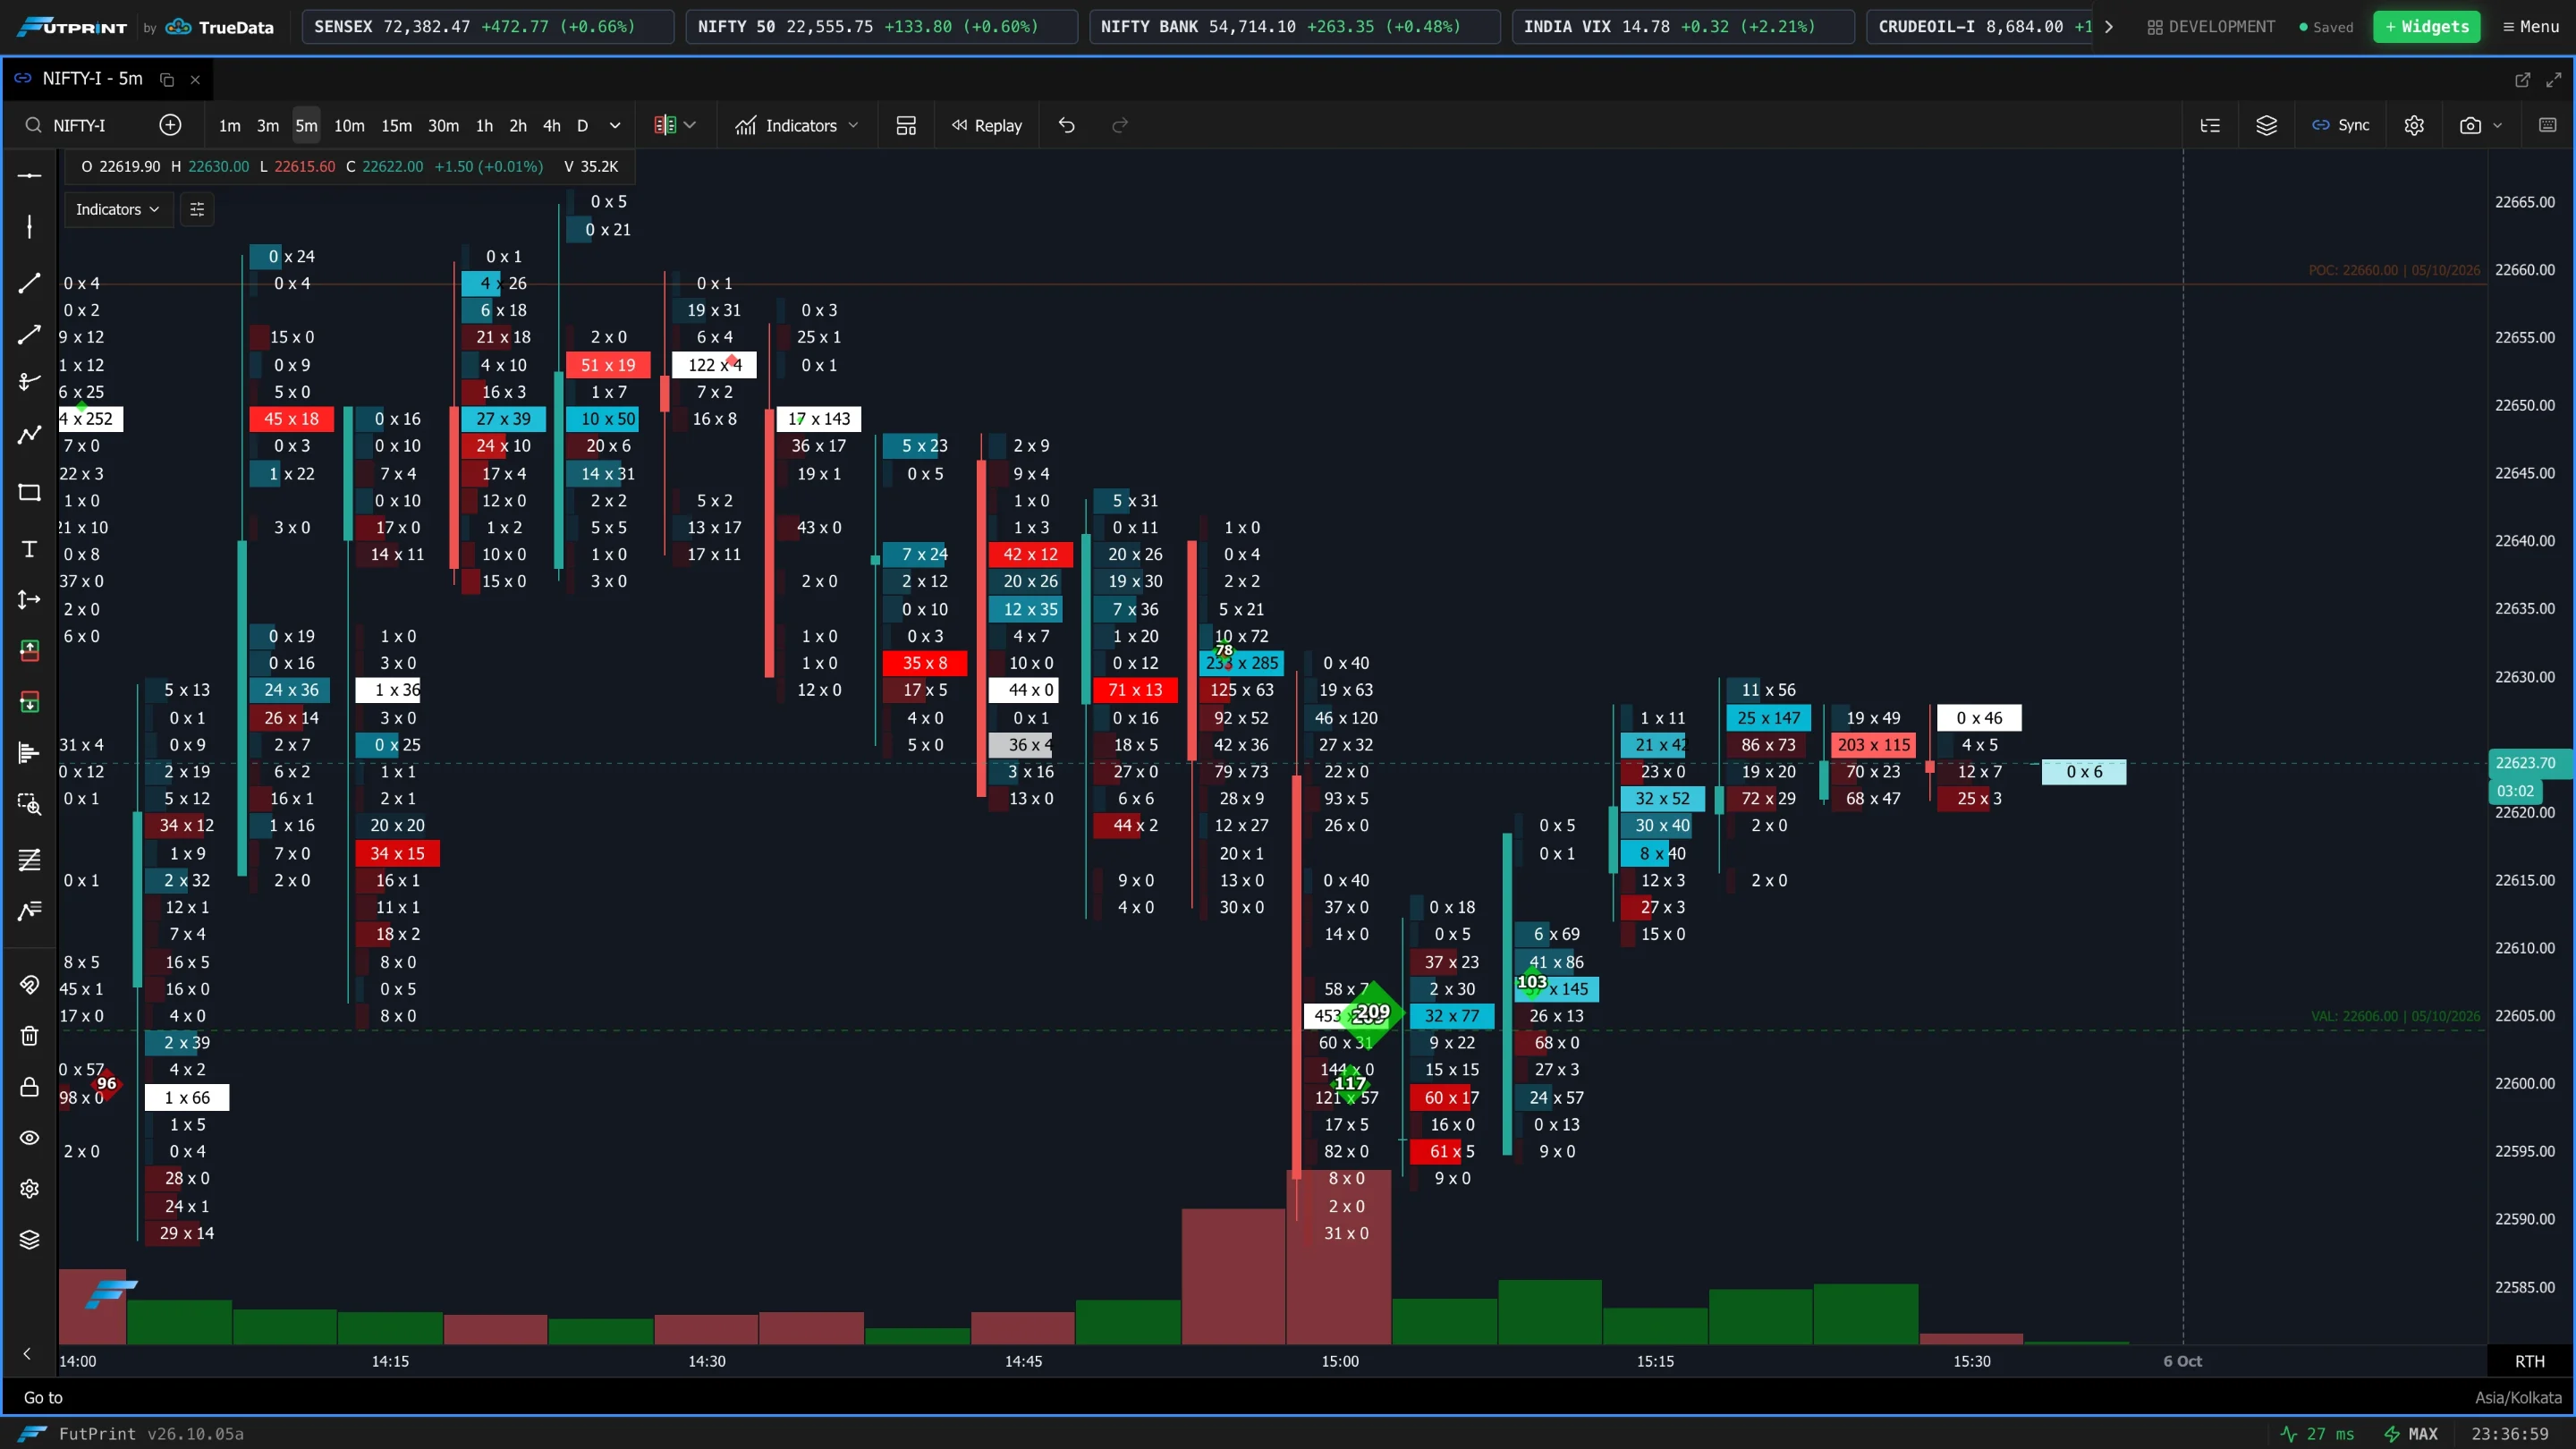
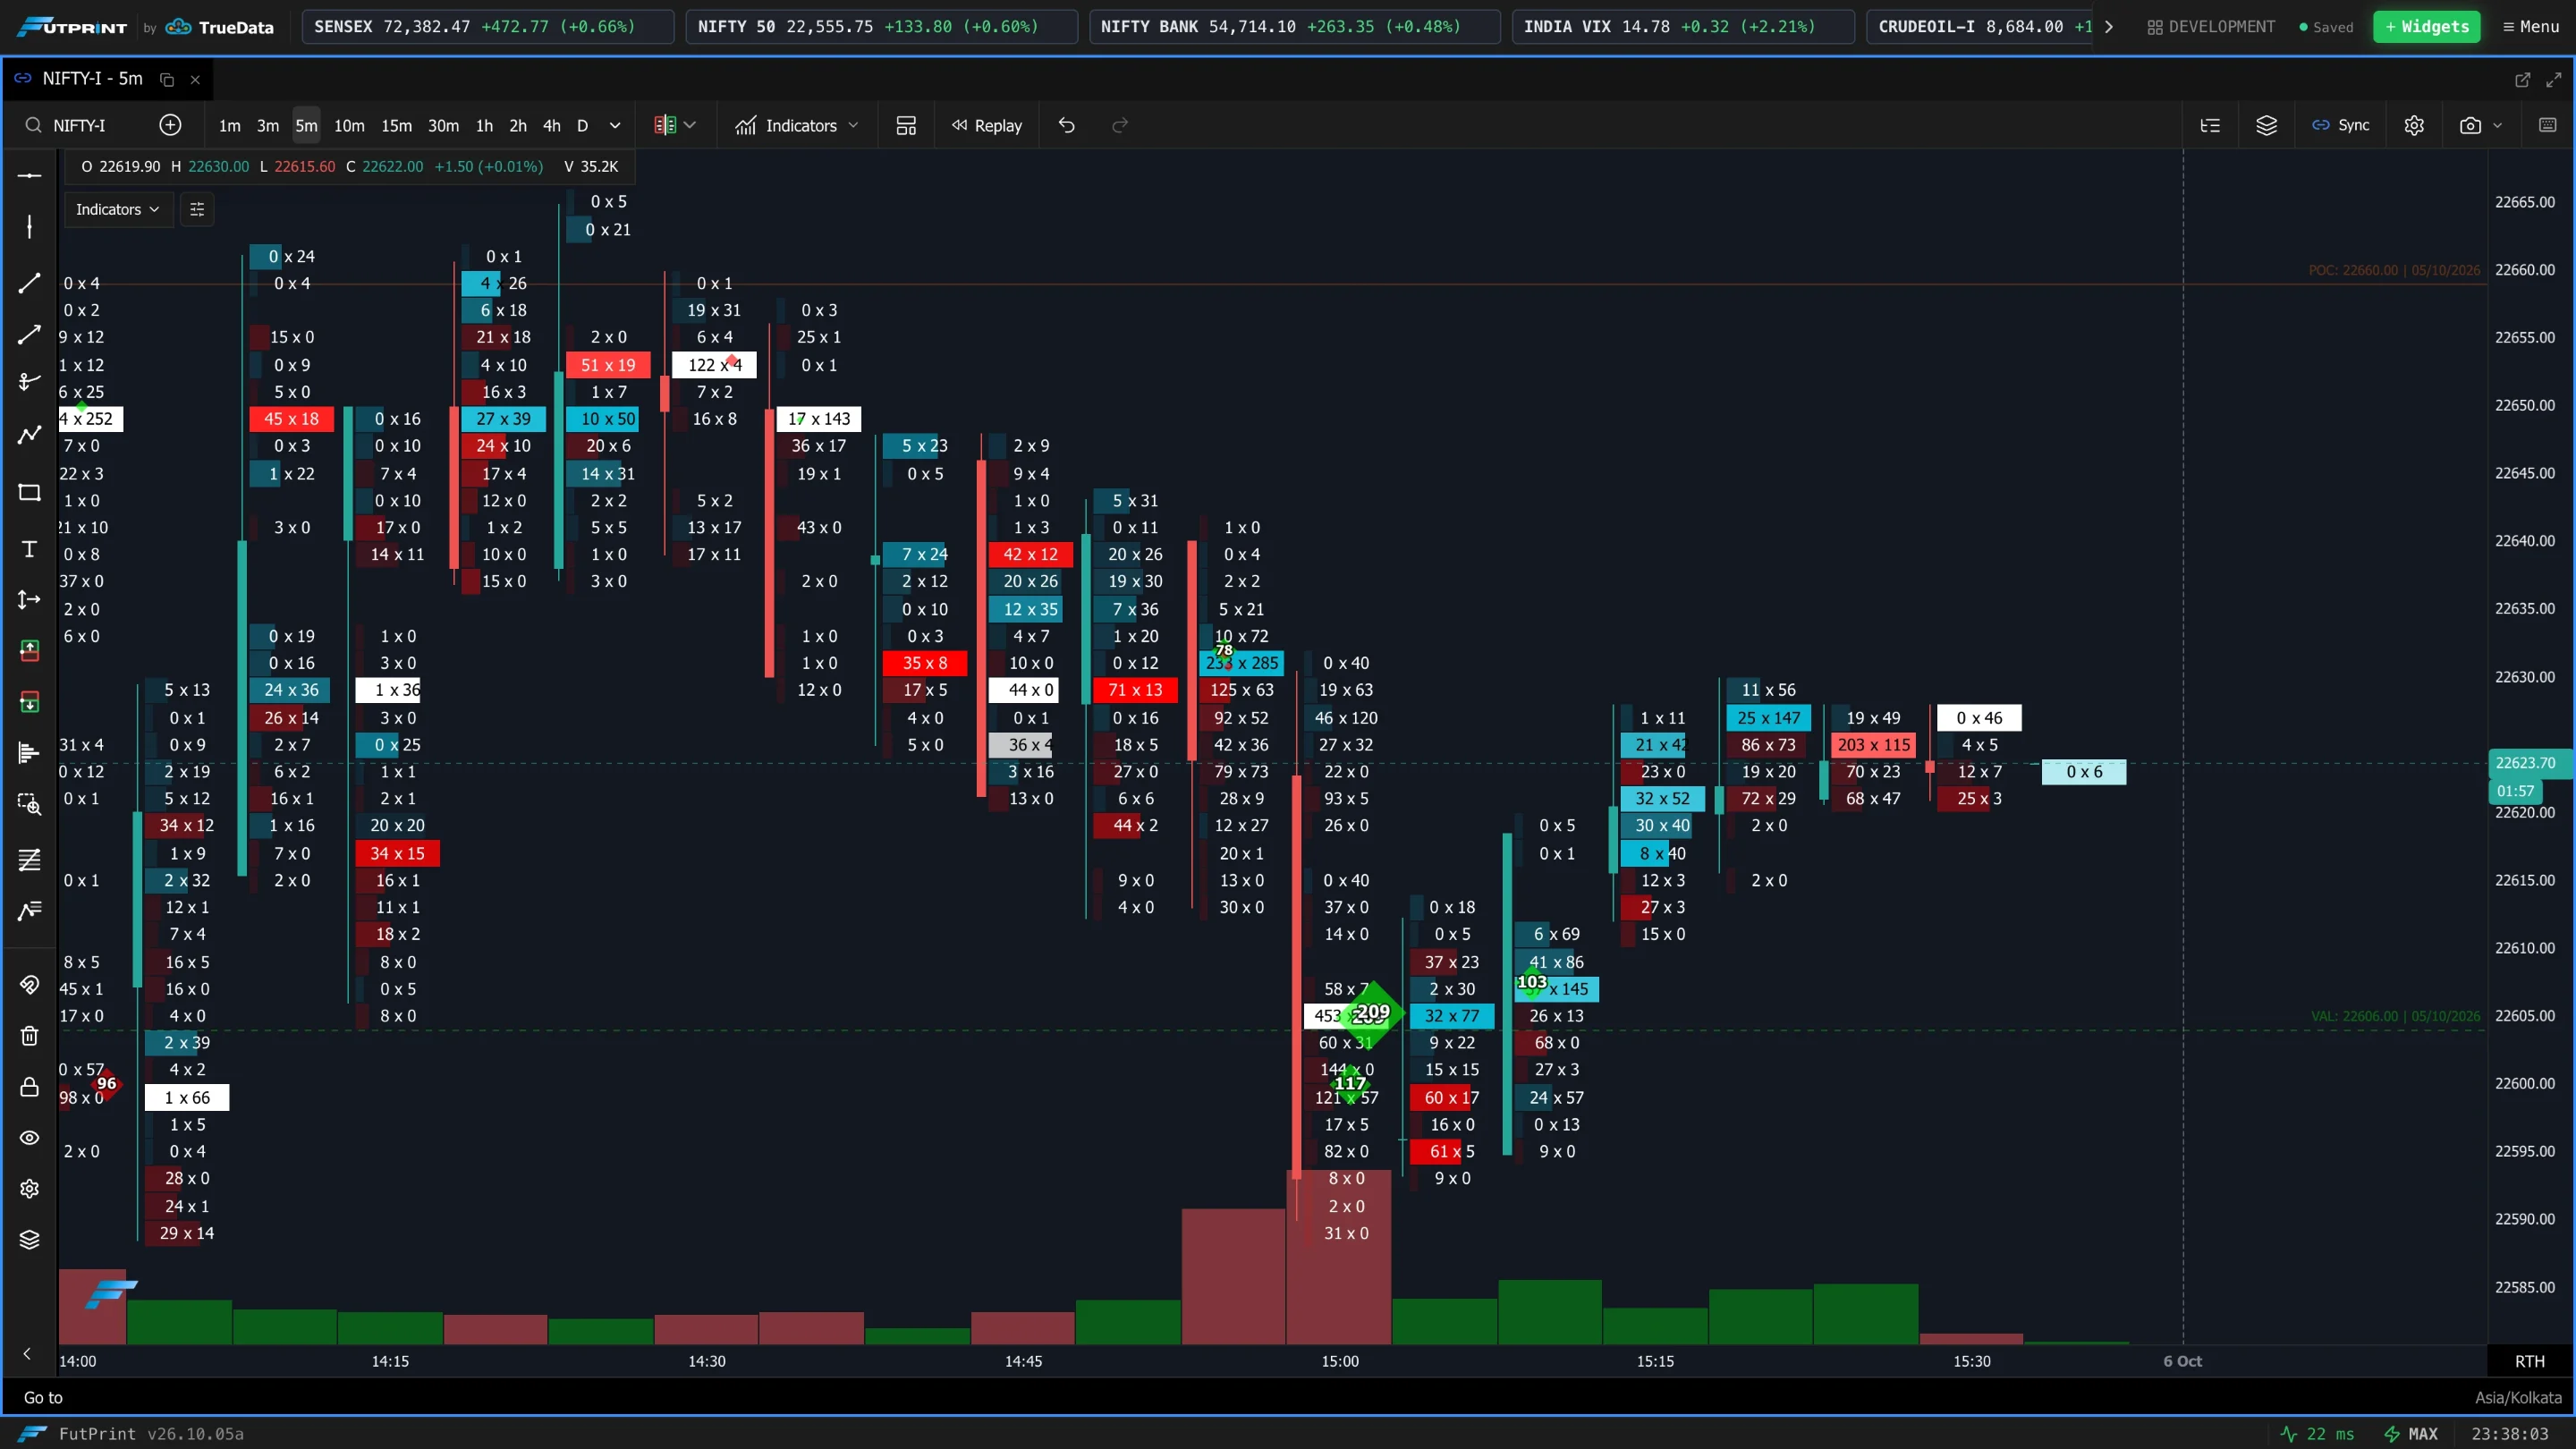
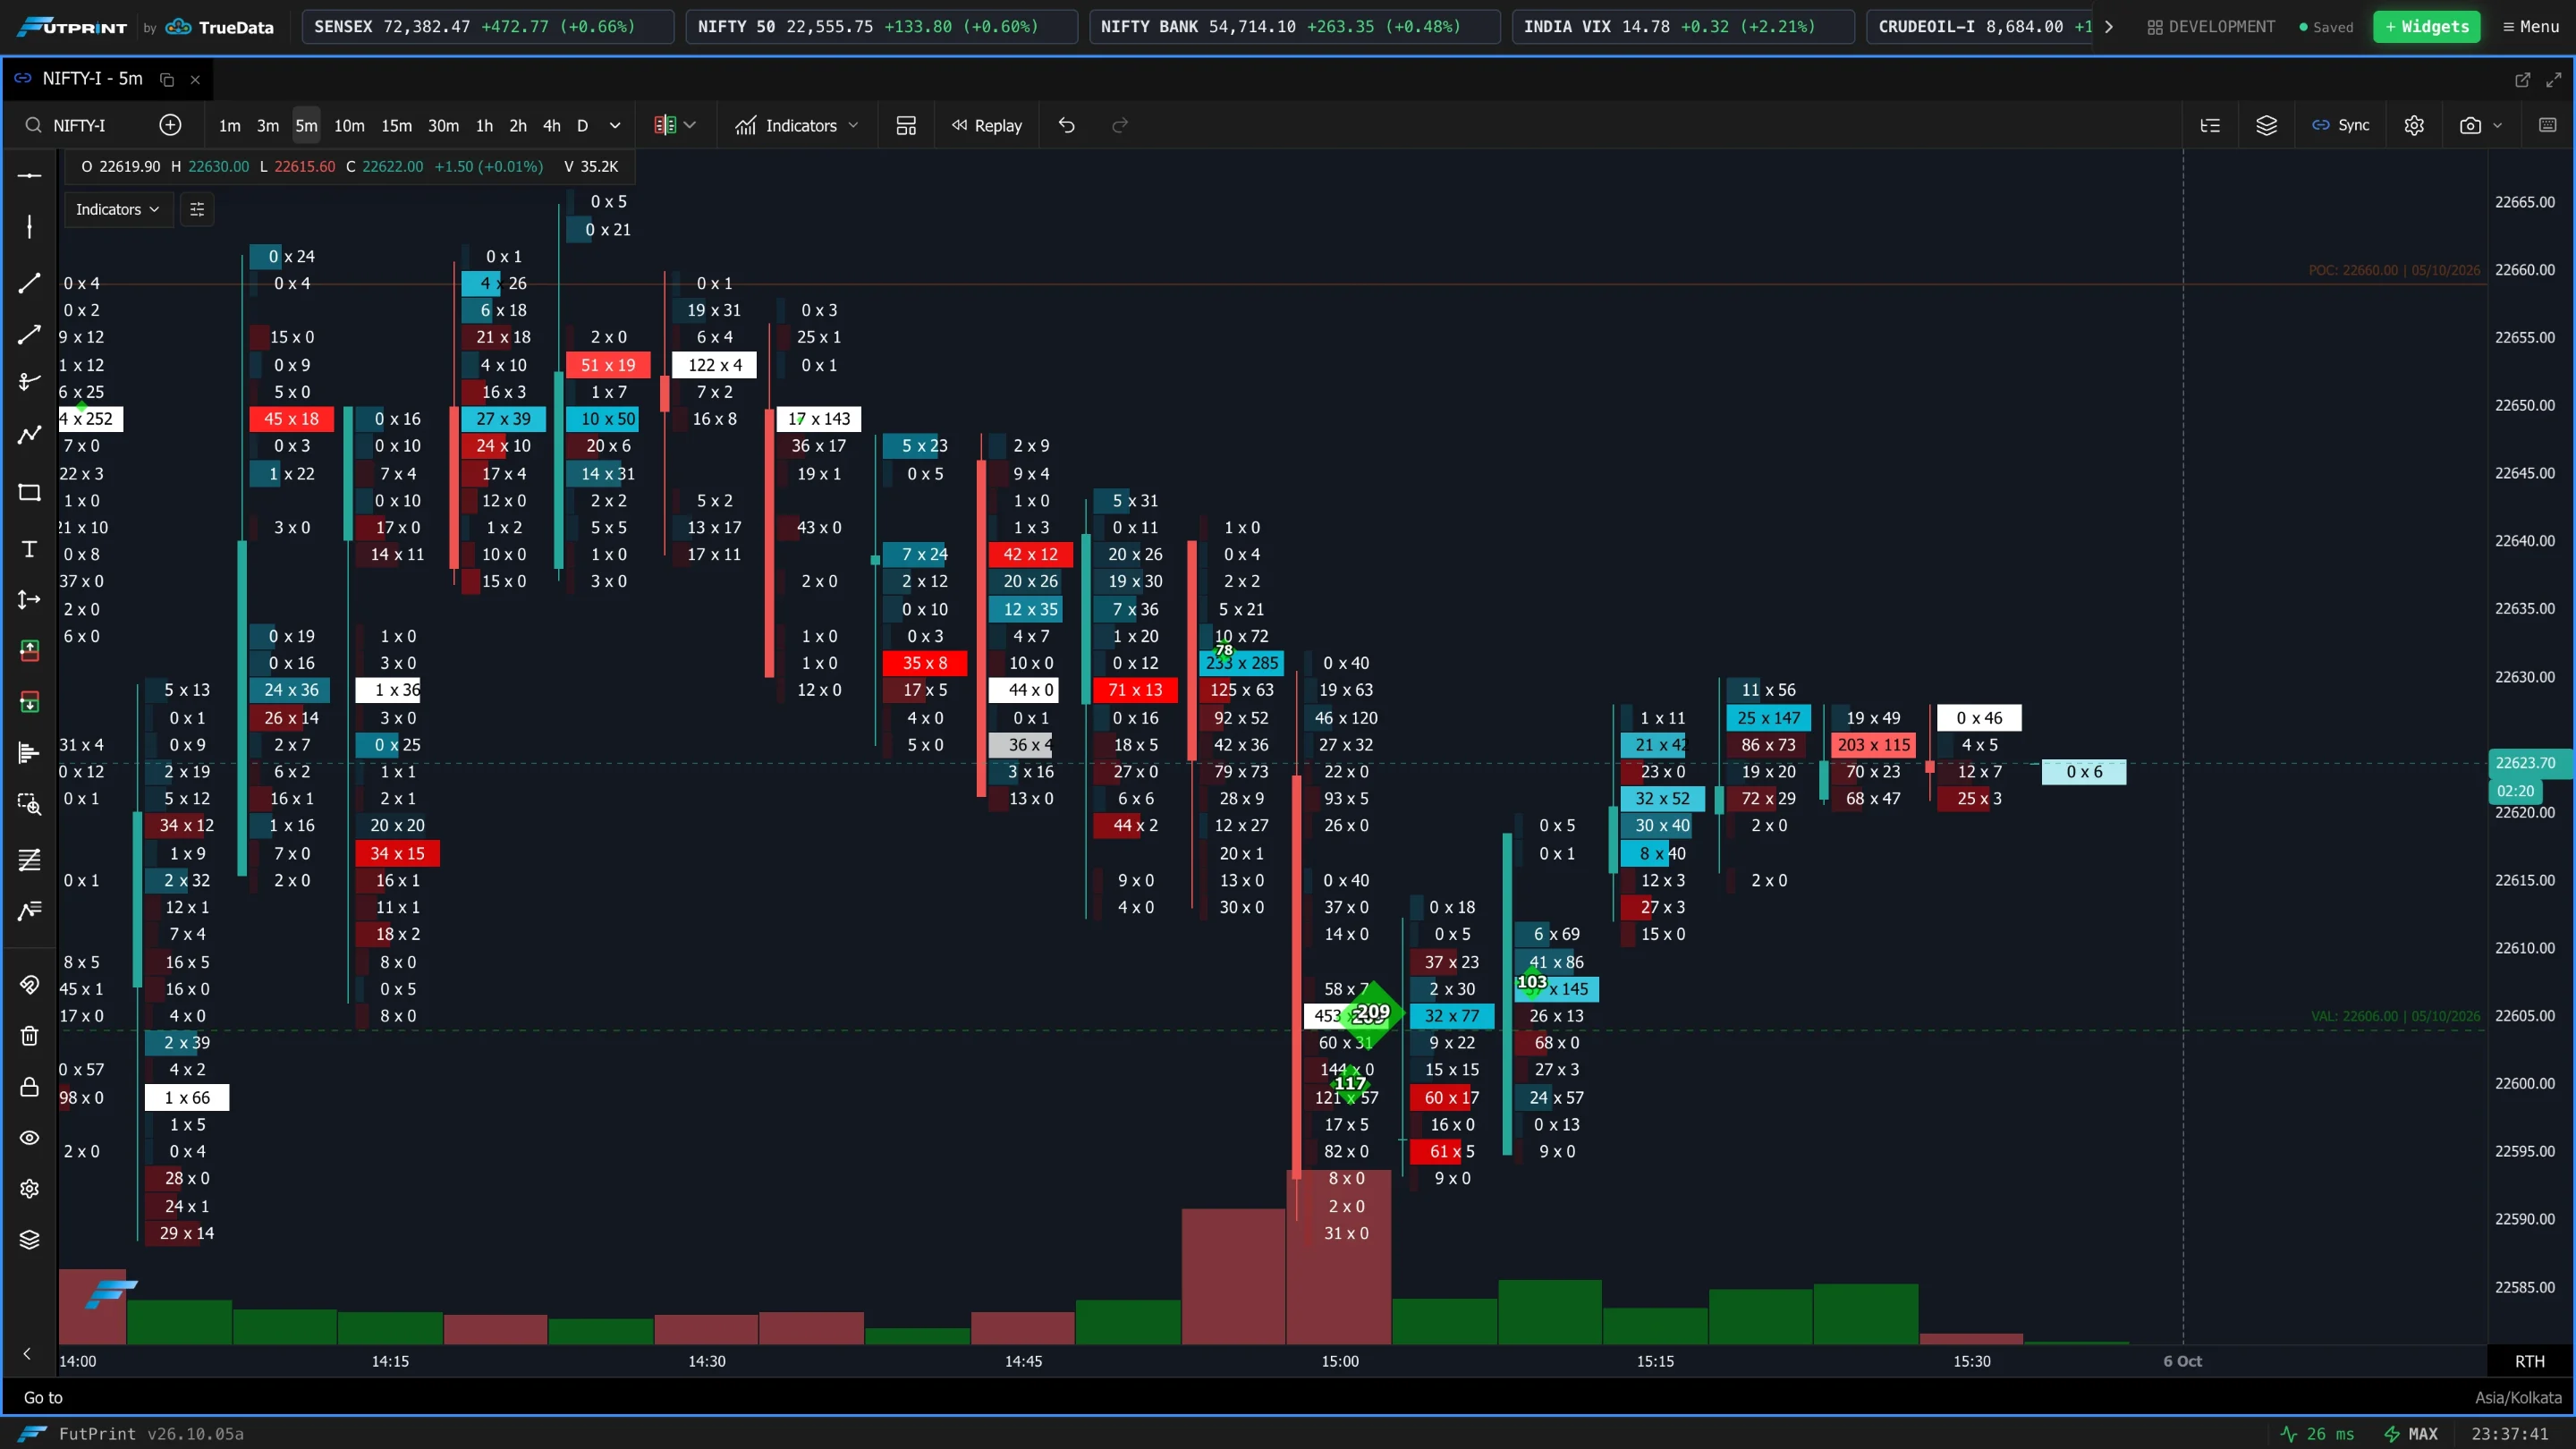
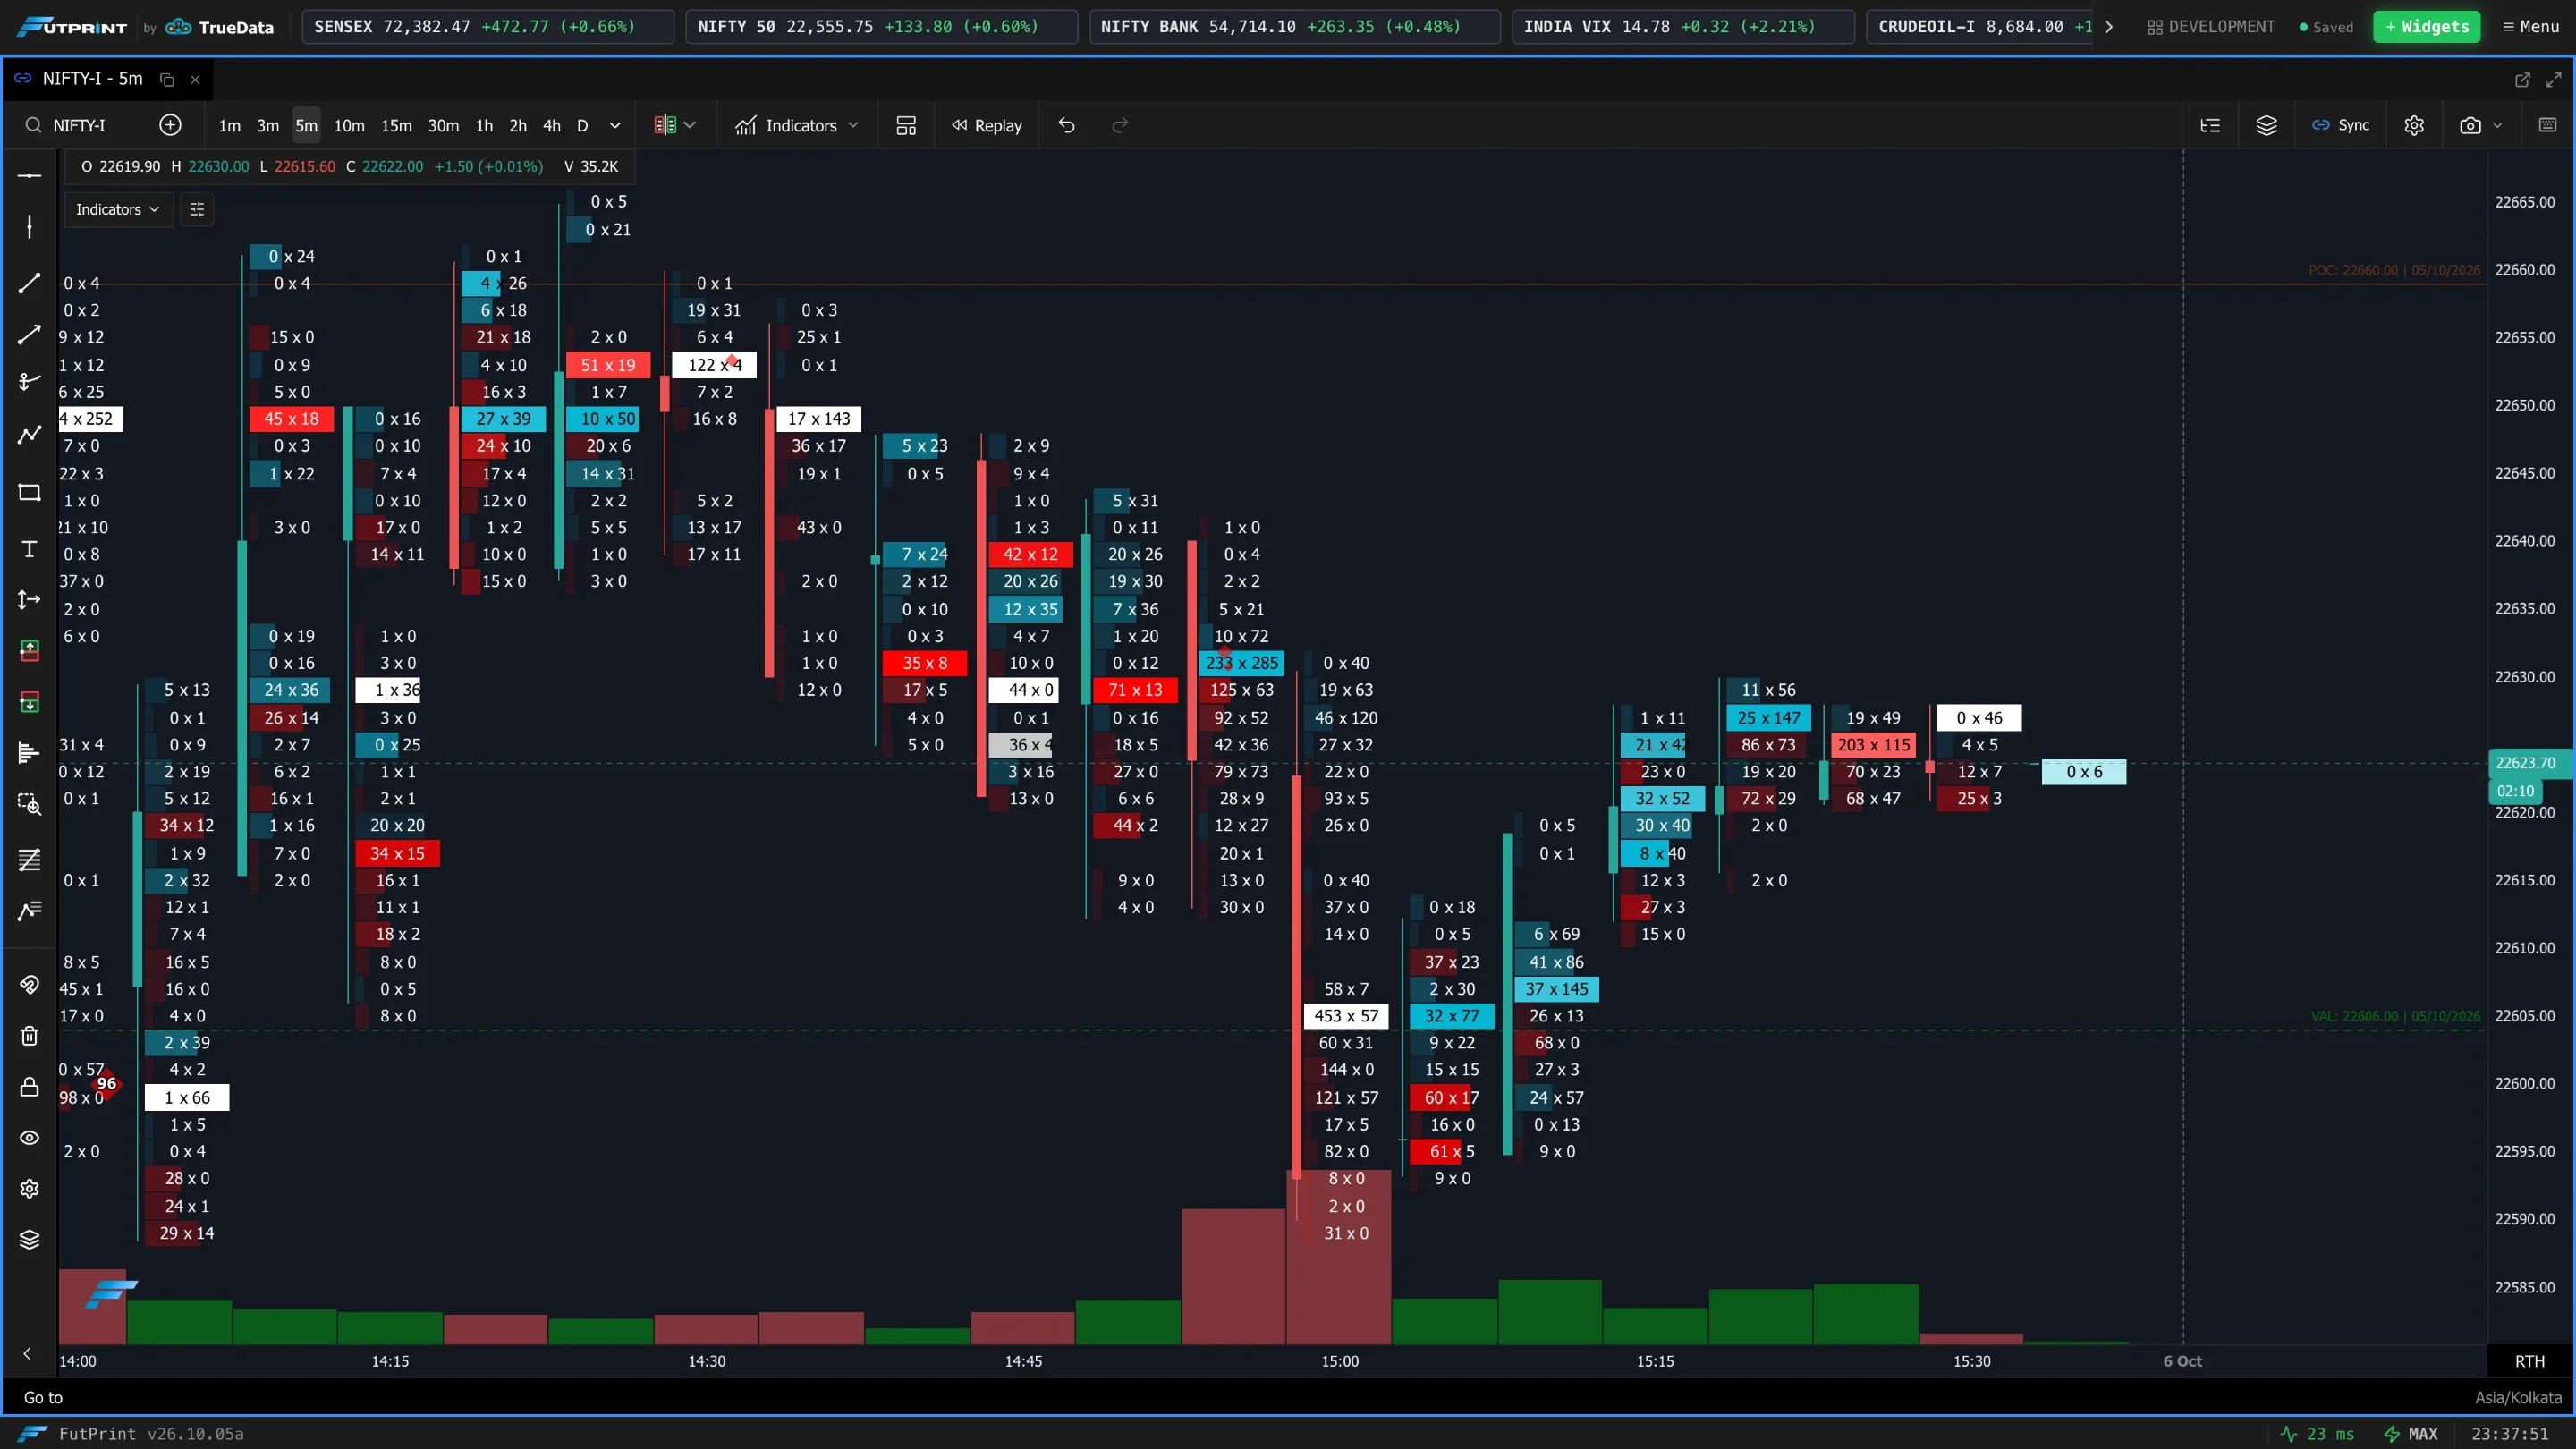
Every screenshot on this page shows the whole chart in both themes — use the Dark / Light switch above any image. Each one changes only the setting being described: all other overlays (imbalances, Big Trades, POC, value area, statistics) are off, on NIFTY futures, 5-minute candles, with a 40-tick bin size. Click an image to open it full size.
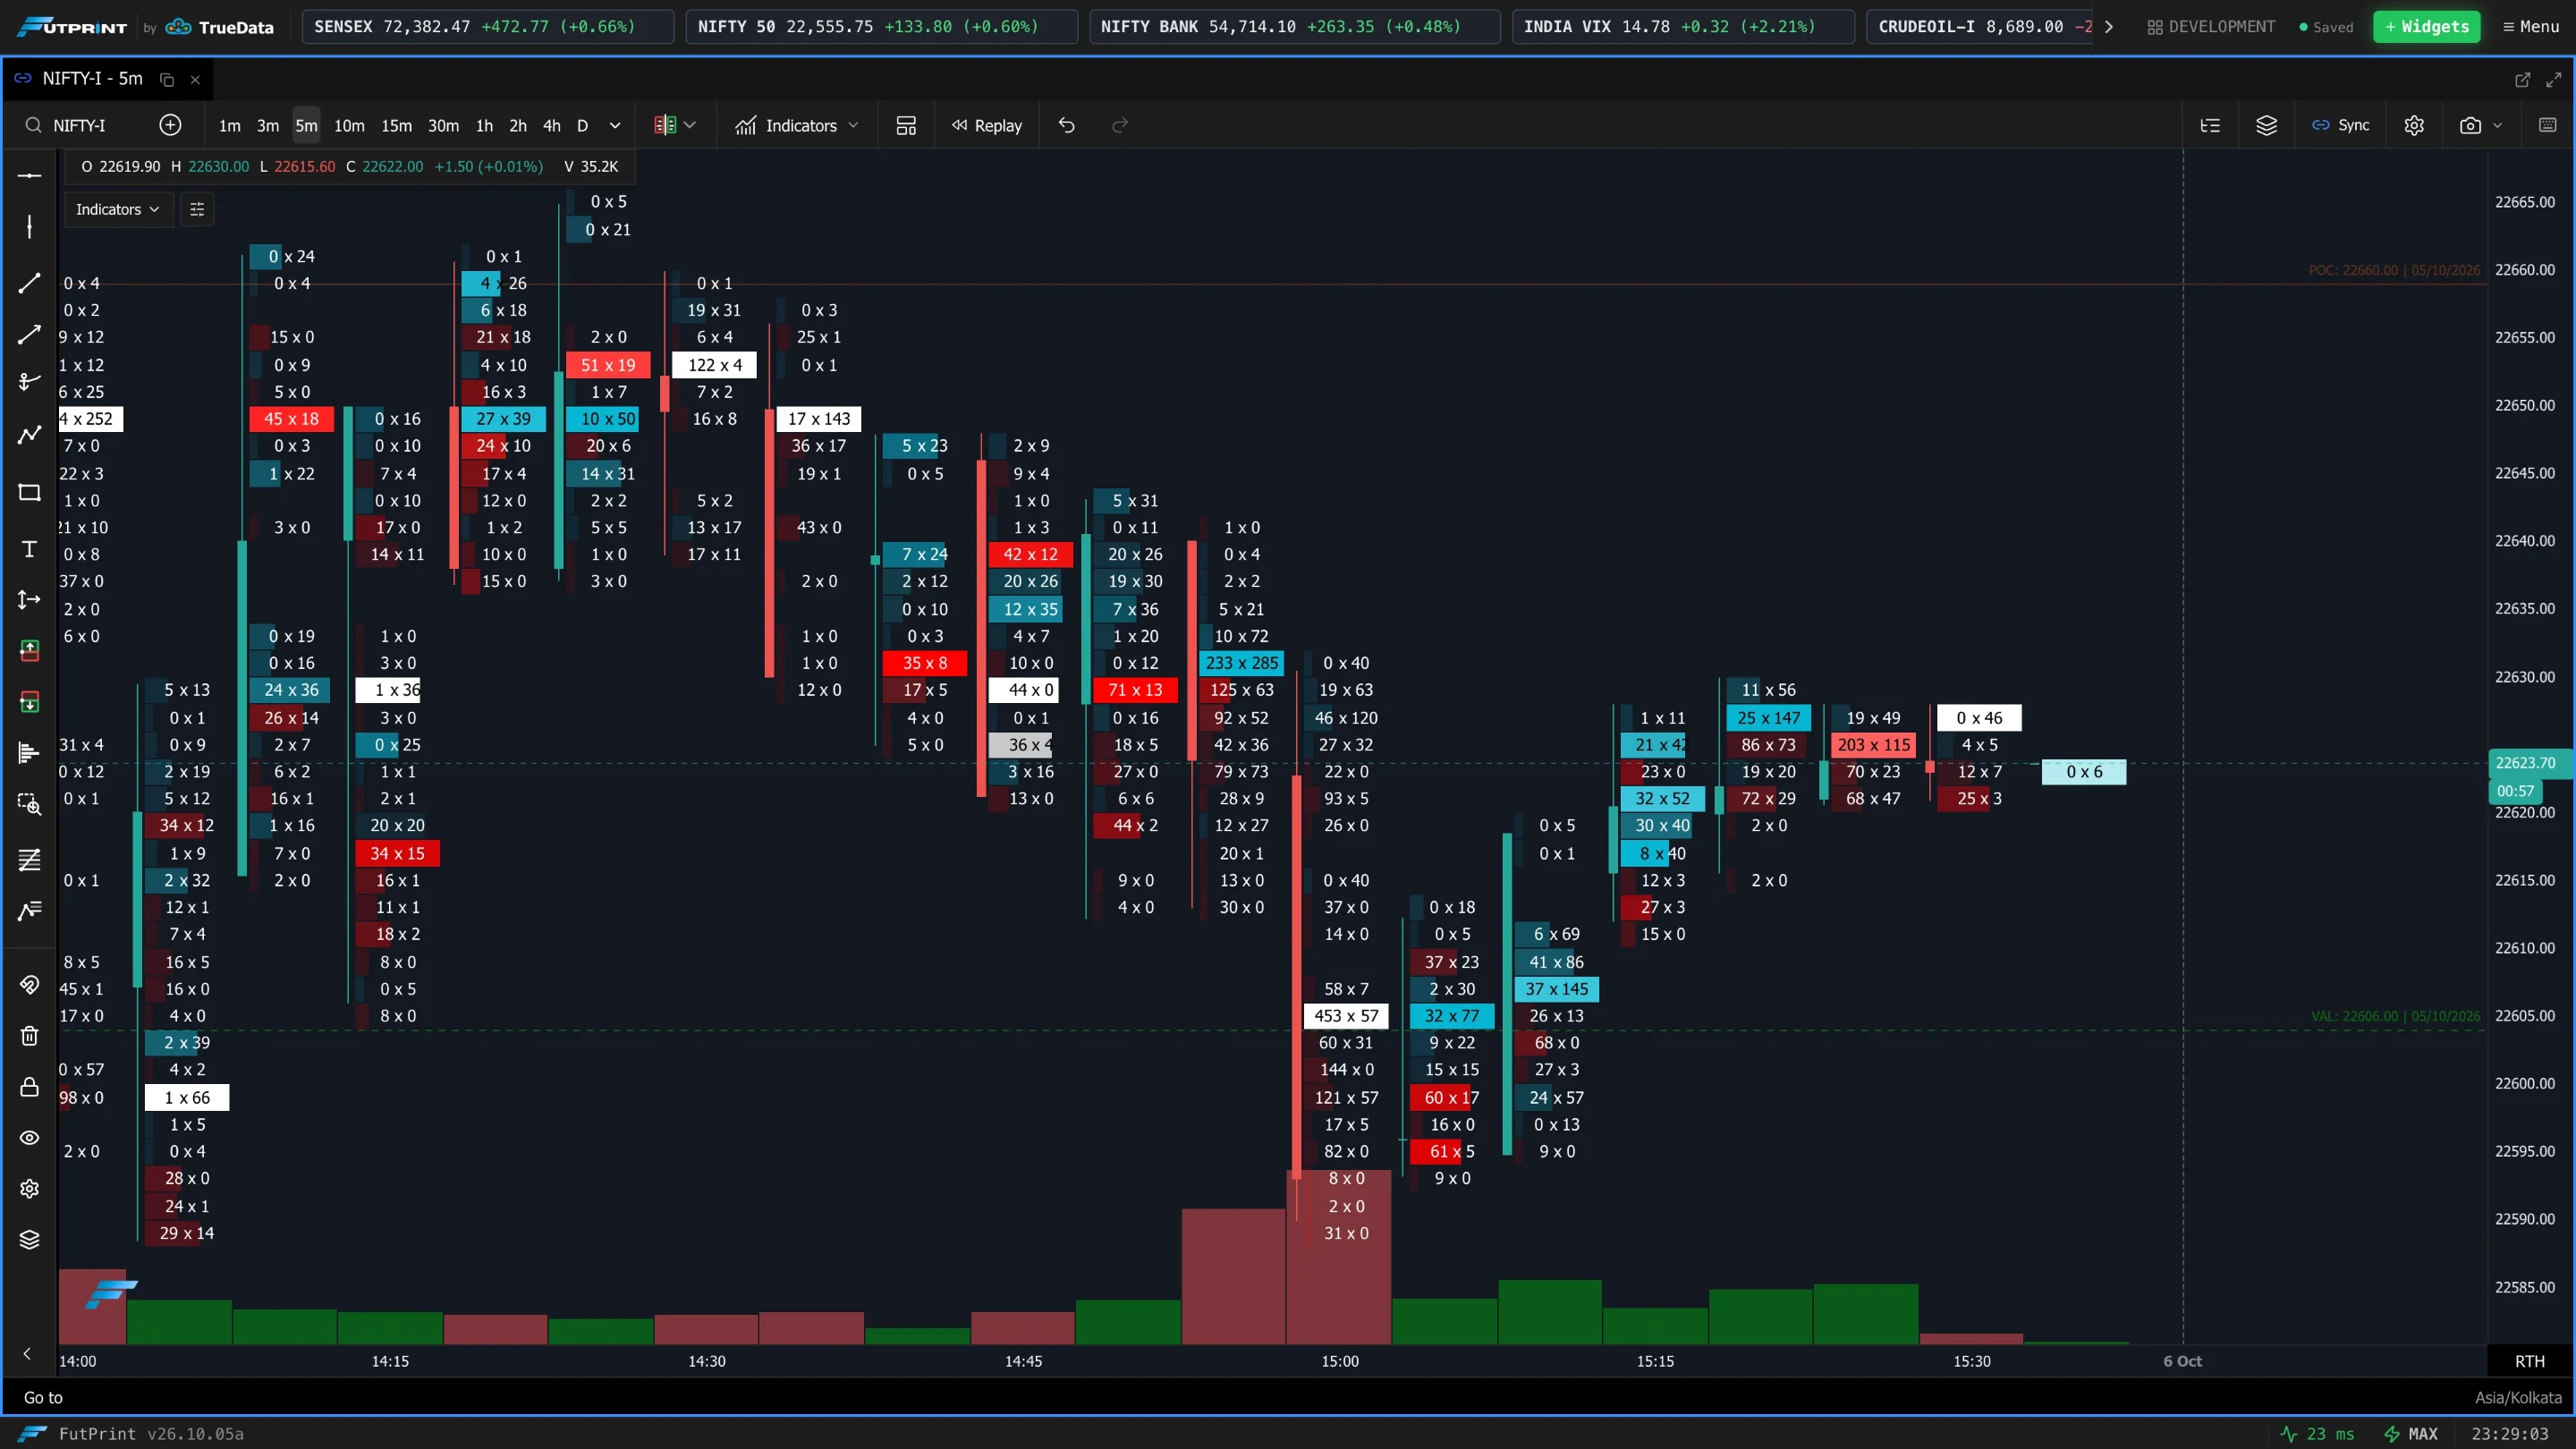
Don't configure everything at once. Pick a Bin Size Mode, choose a Cluster Style and the Data Type for each column, then turn on just the signals you actually trade (POC, Value Area, Imbalances). Open the rest as you need them.
Open Ctrl/Cmd C on a footprint chart to jump straight to these settings. The ; key toggles the quick bin-size popup.
Footprint Presets
| Setting | What it does |
|---|---|
| Apply preset | Quickly switch the footprint to a saved single-sided profile layout. Choose Custom (no preset) to configure everything by hand, or pick a preset as a starting point. |

Volume Settings
How price levels (bins) are formed and how volume numbers are shown.
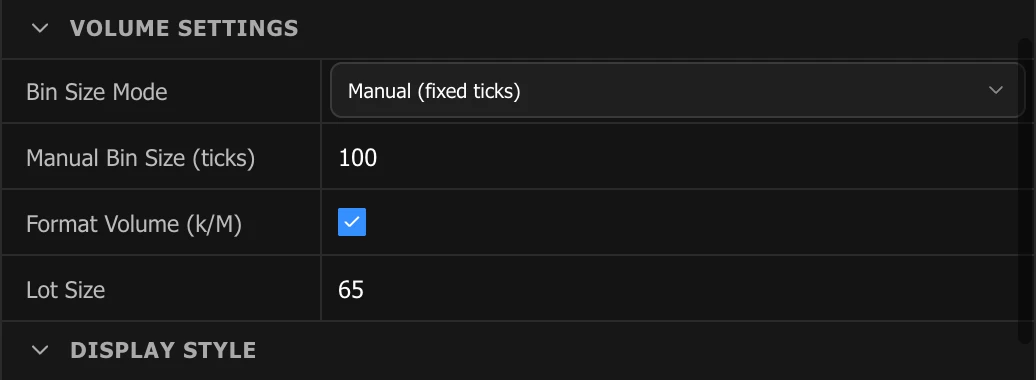
Bin Size Mode
How footprint bins are sized. Three modes:
-
Automatic (range based) — bins are sized from the visible price range, so the number of levels stays sensible as you zoom.
-
Manual (fixed ticks) — you set a fixed number of ticks per bin (see Manual Bin Size below).
-
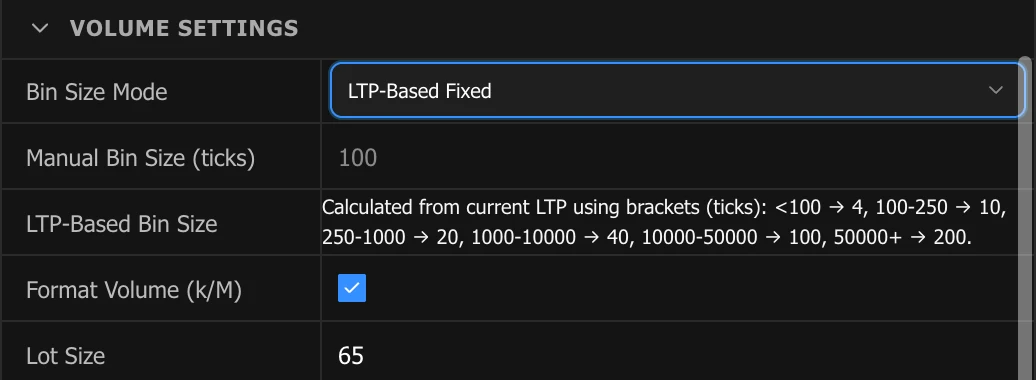
LTP-Based Fixed — the bin size is picked automatically from the current price using fixed brackets, and updates as the symbol's price moves between brackets. The brackets (in ticks) are:
Price (LTP) Bin size (ticks) under 100 4 100 – 250 10 250 – 1,000 20 1,000 – 10,000 40 10,000 – 50,000 100 50,000+ 200
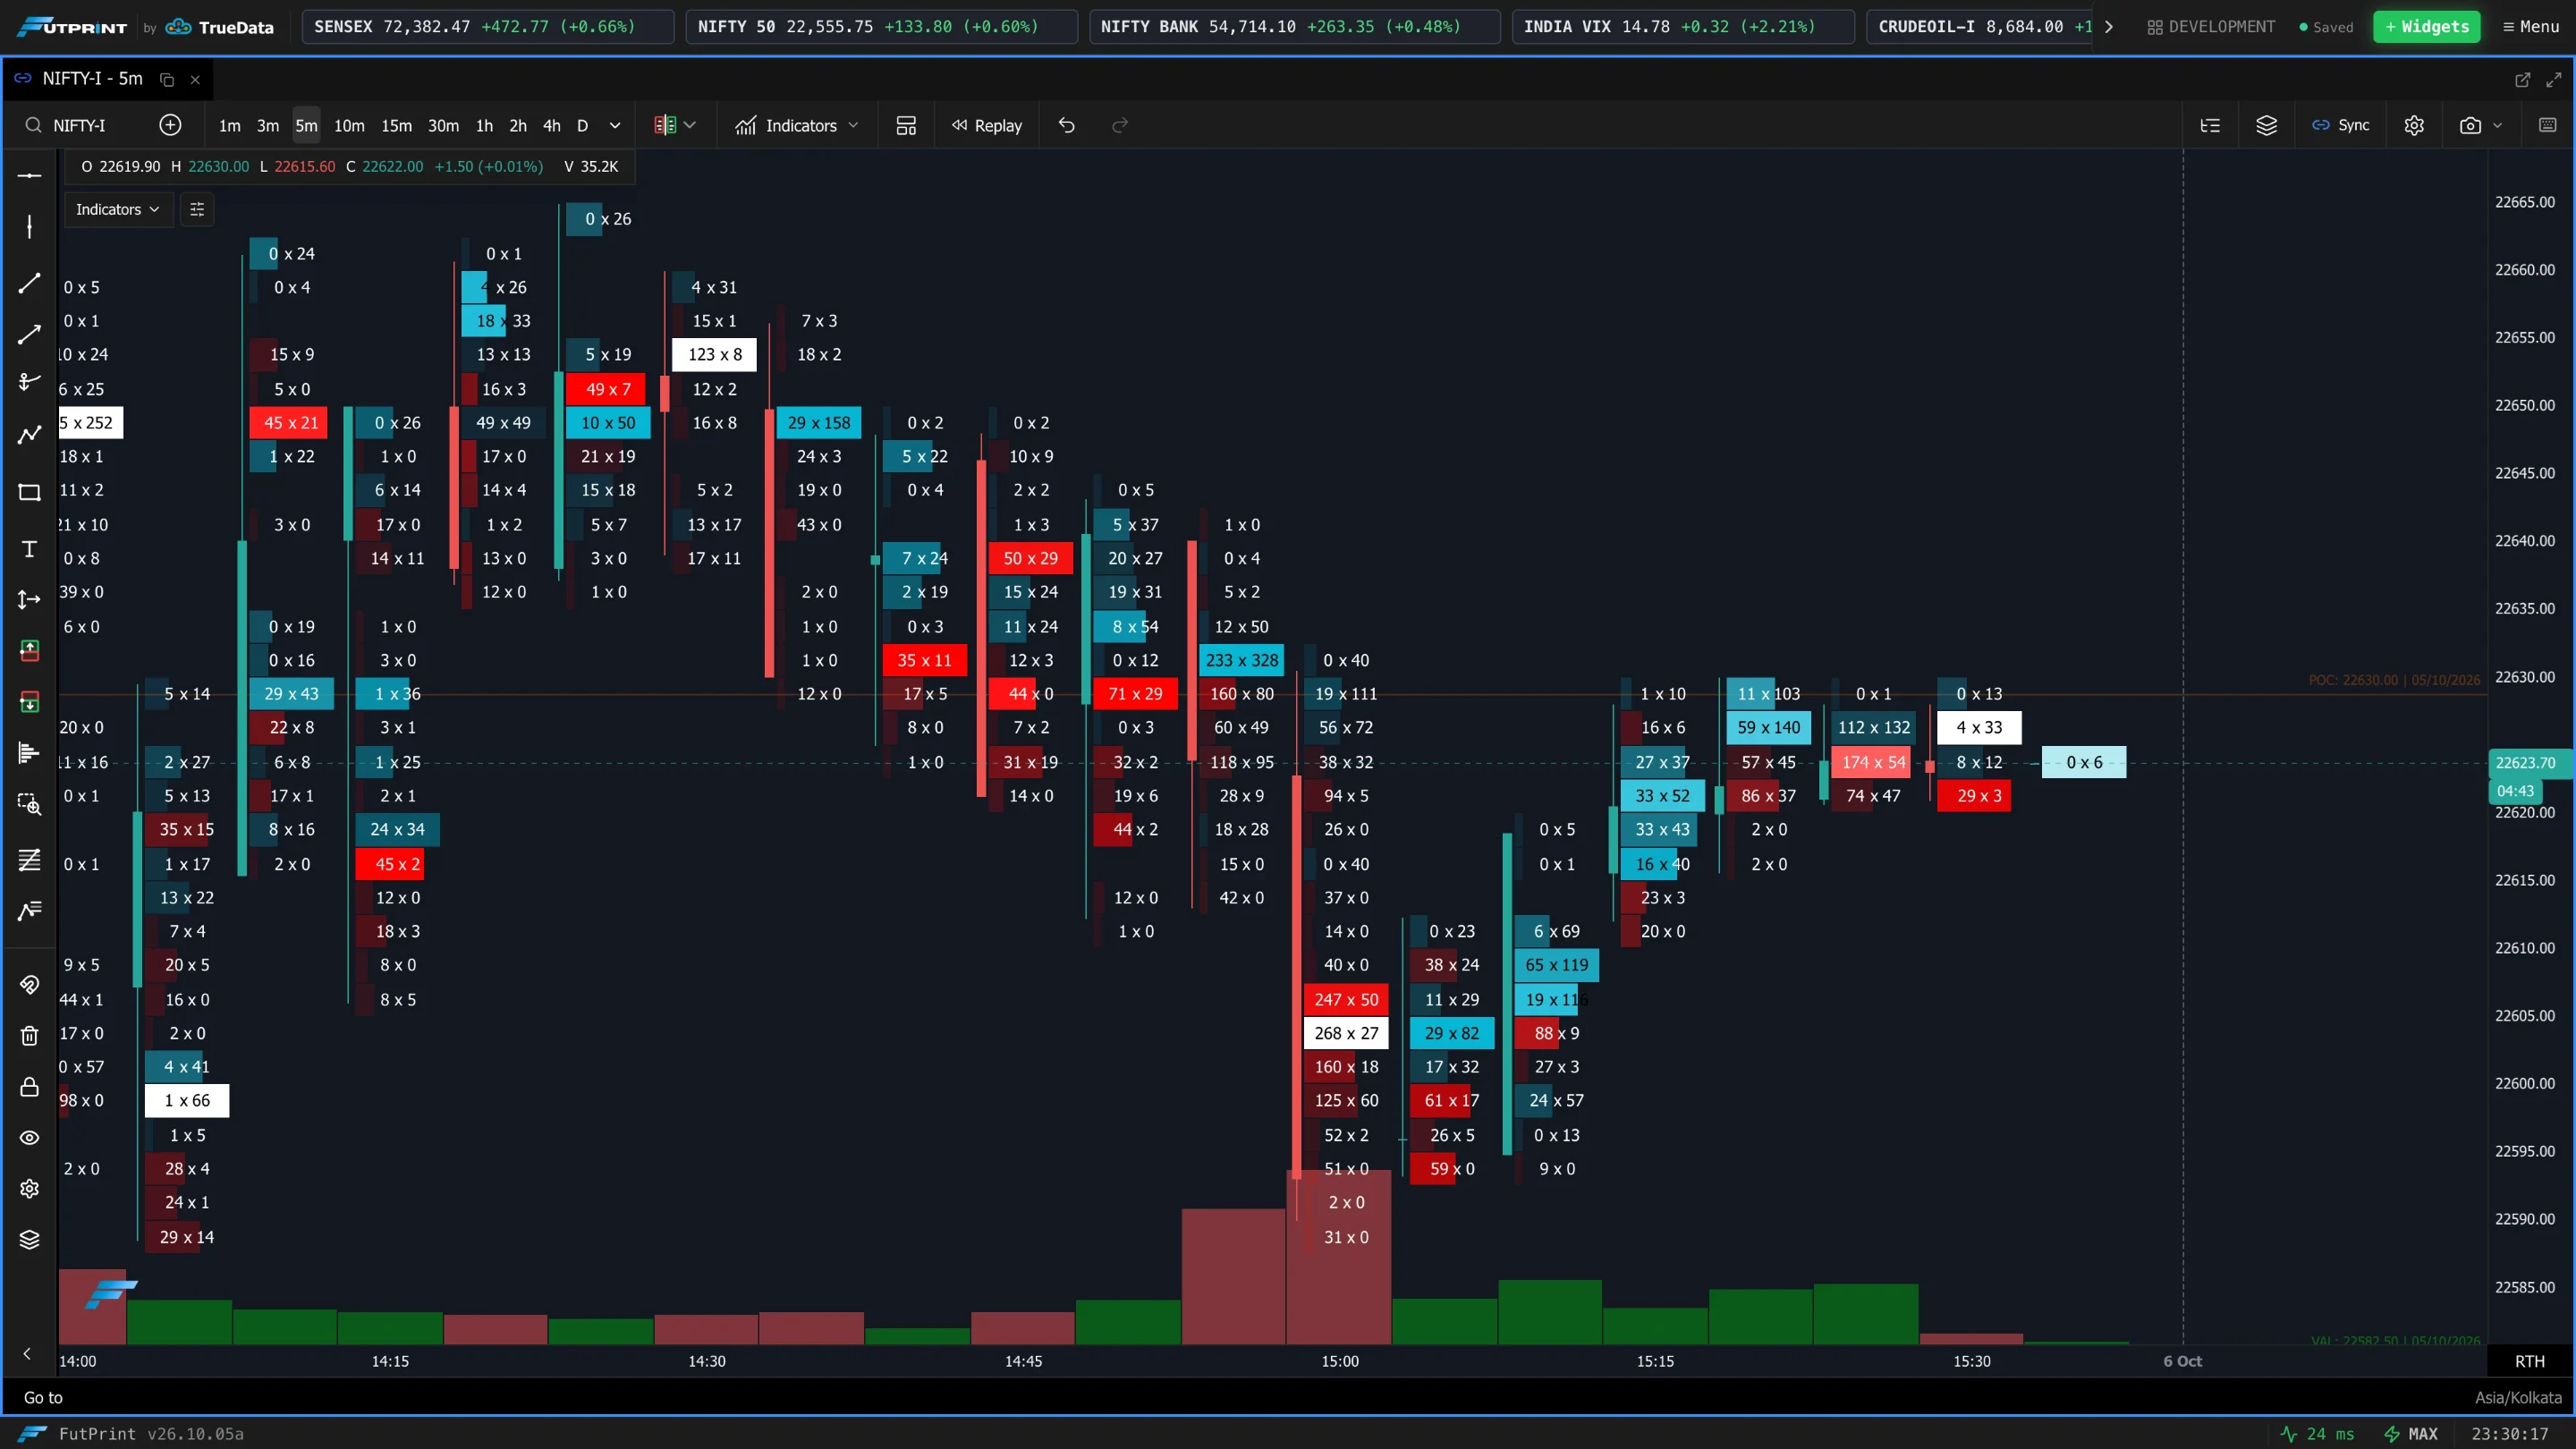
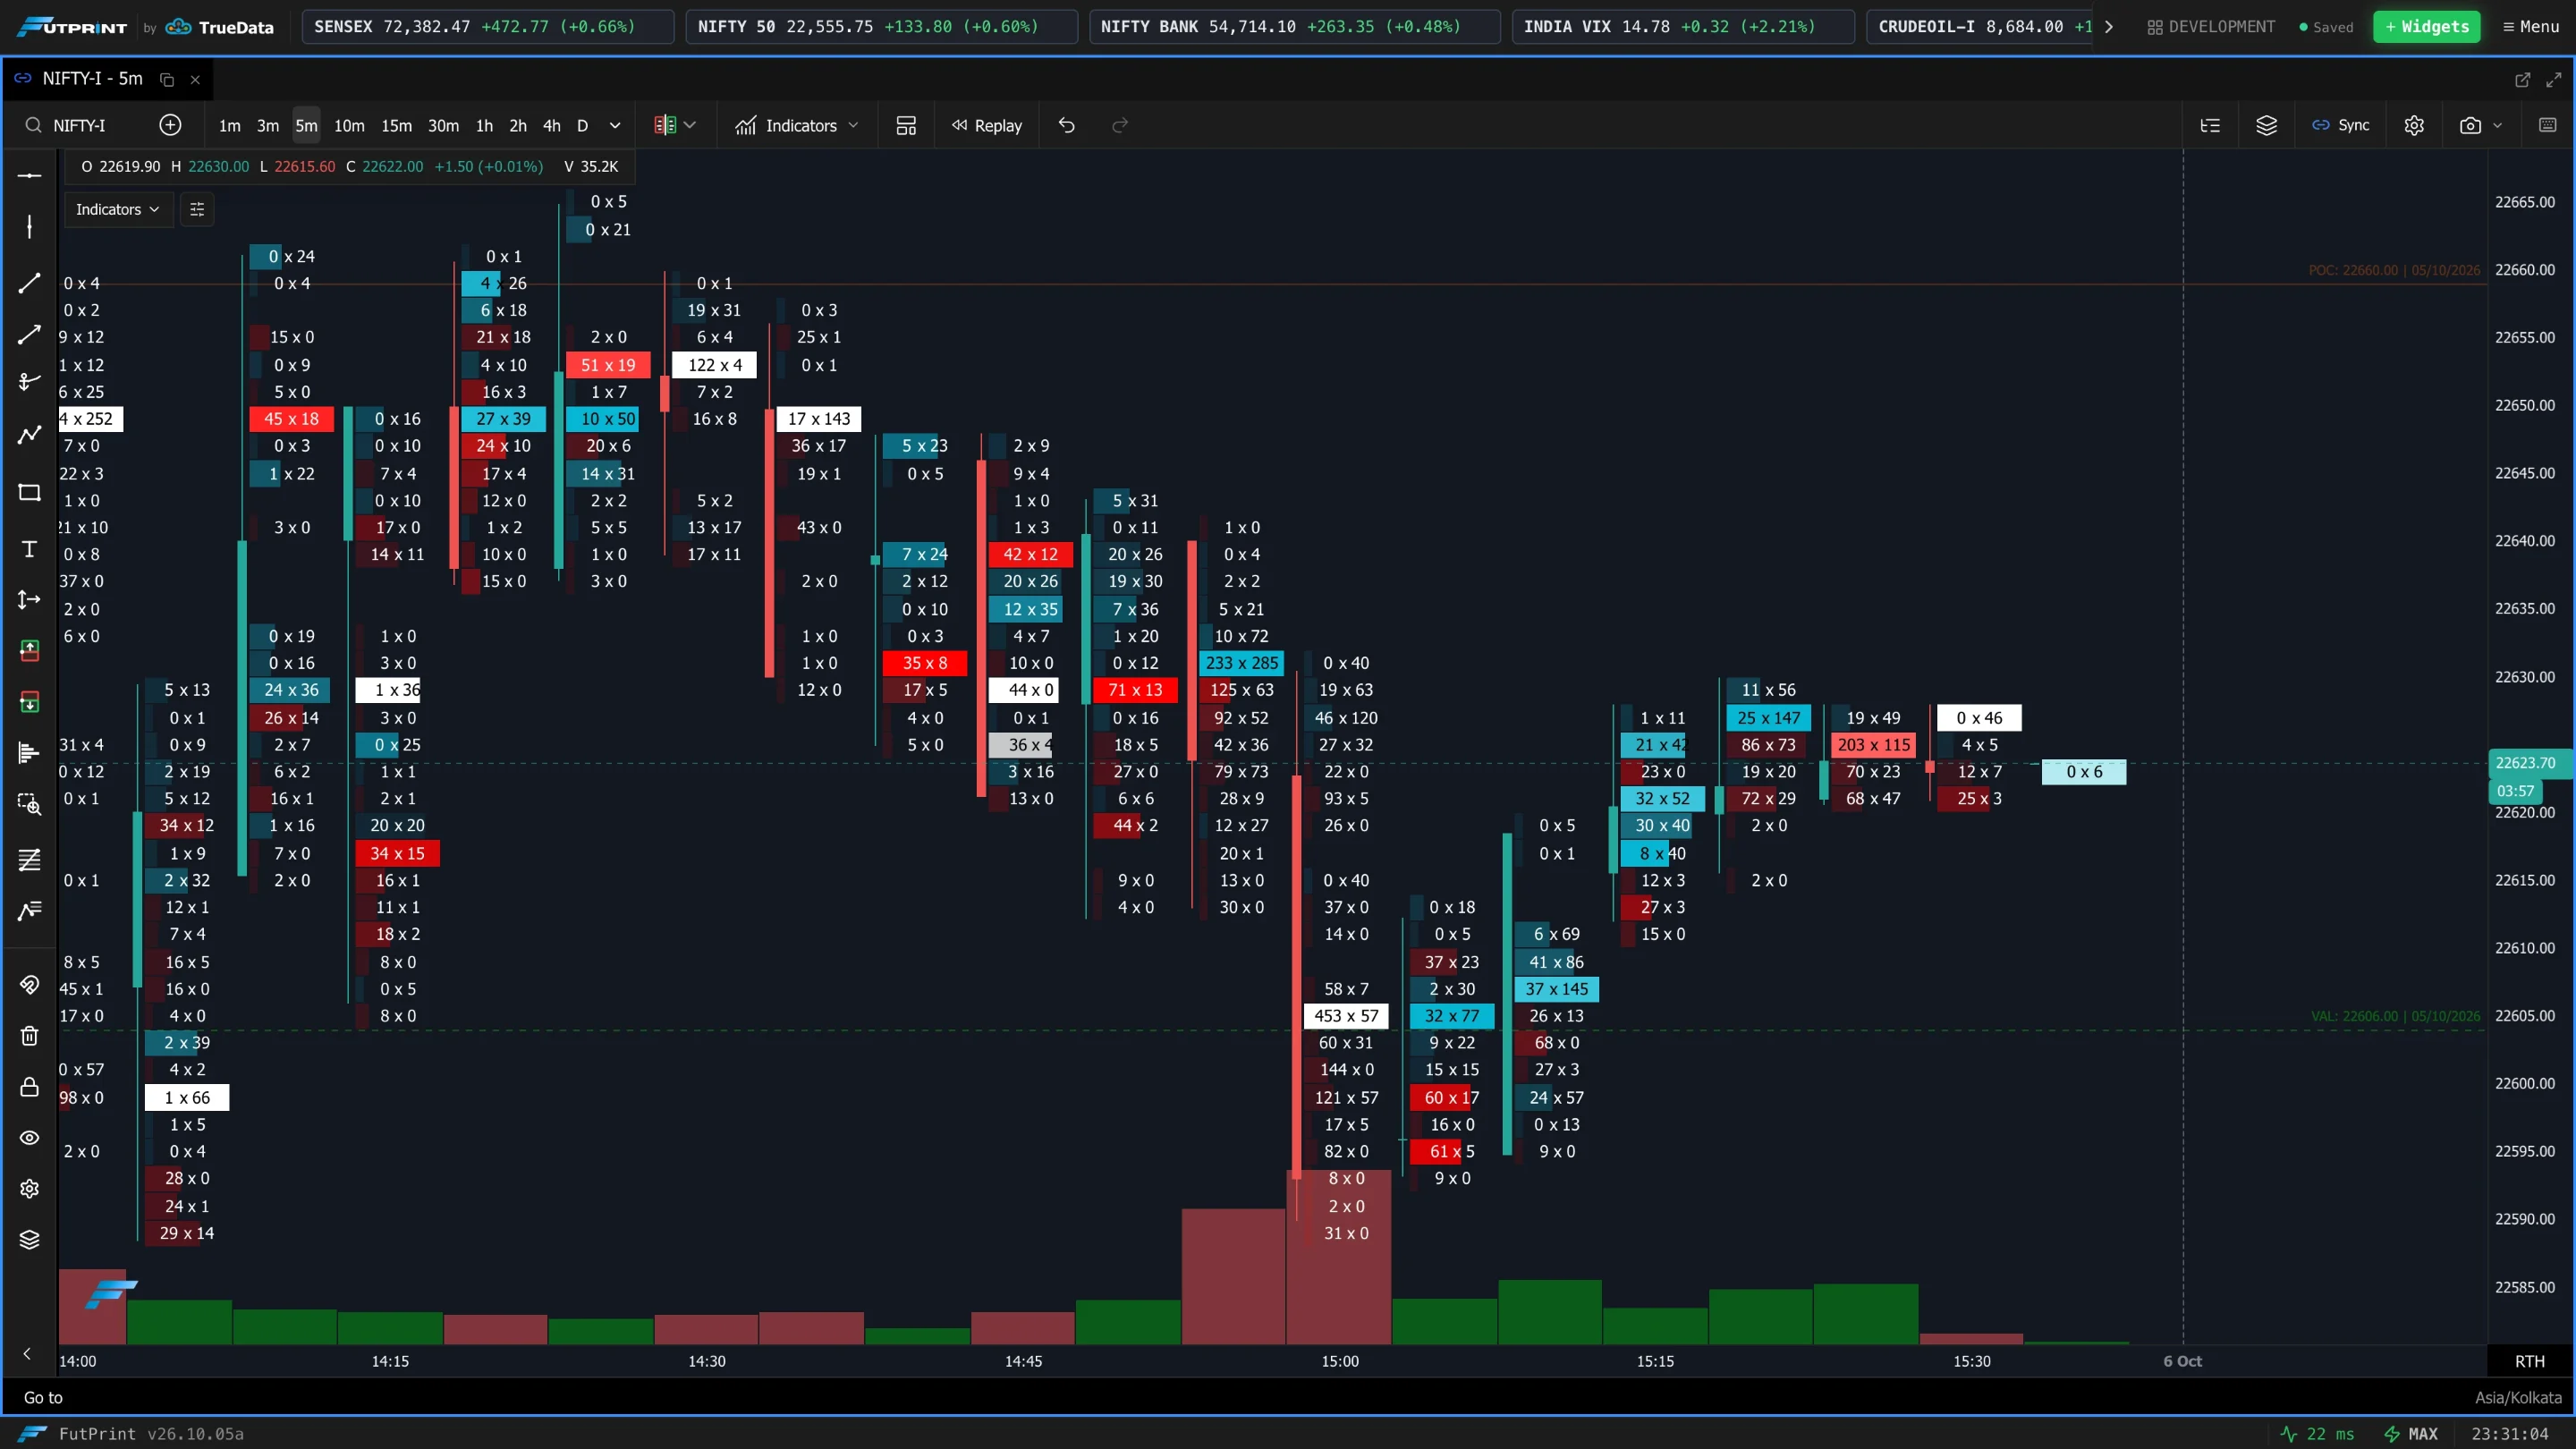
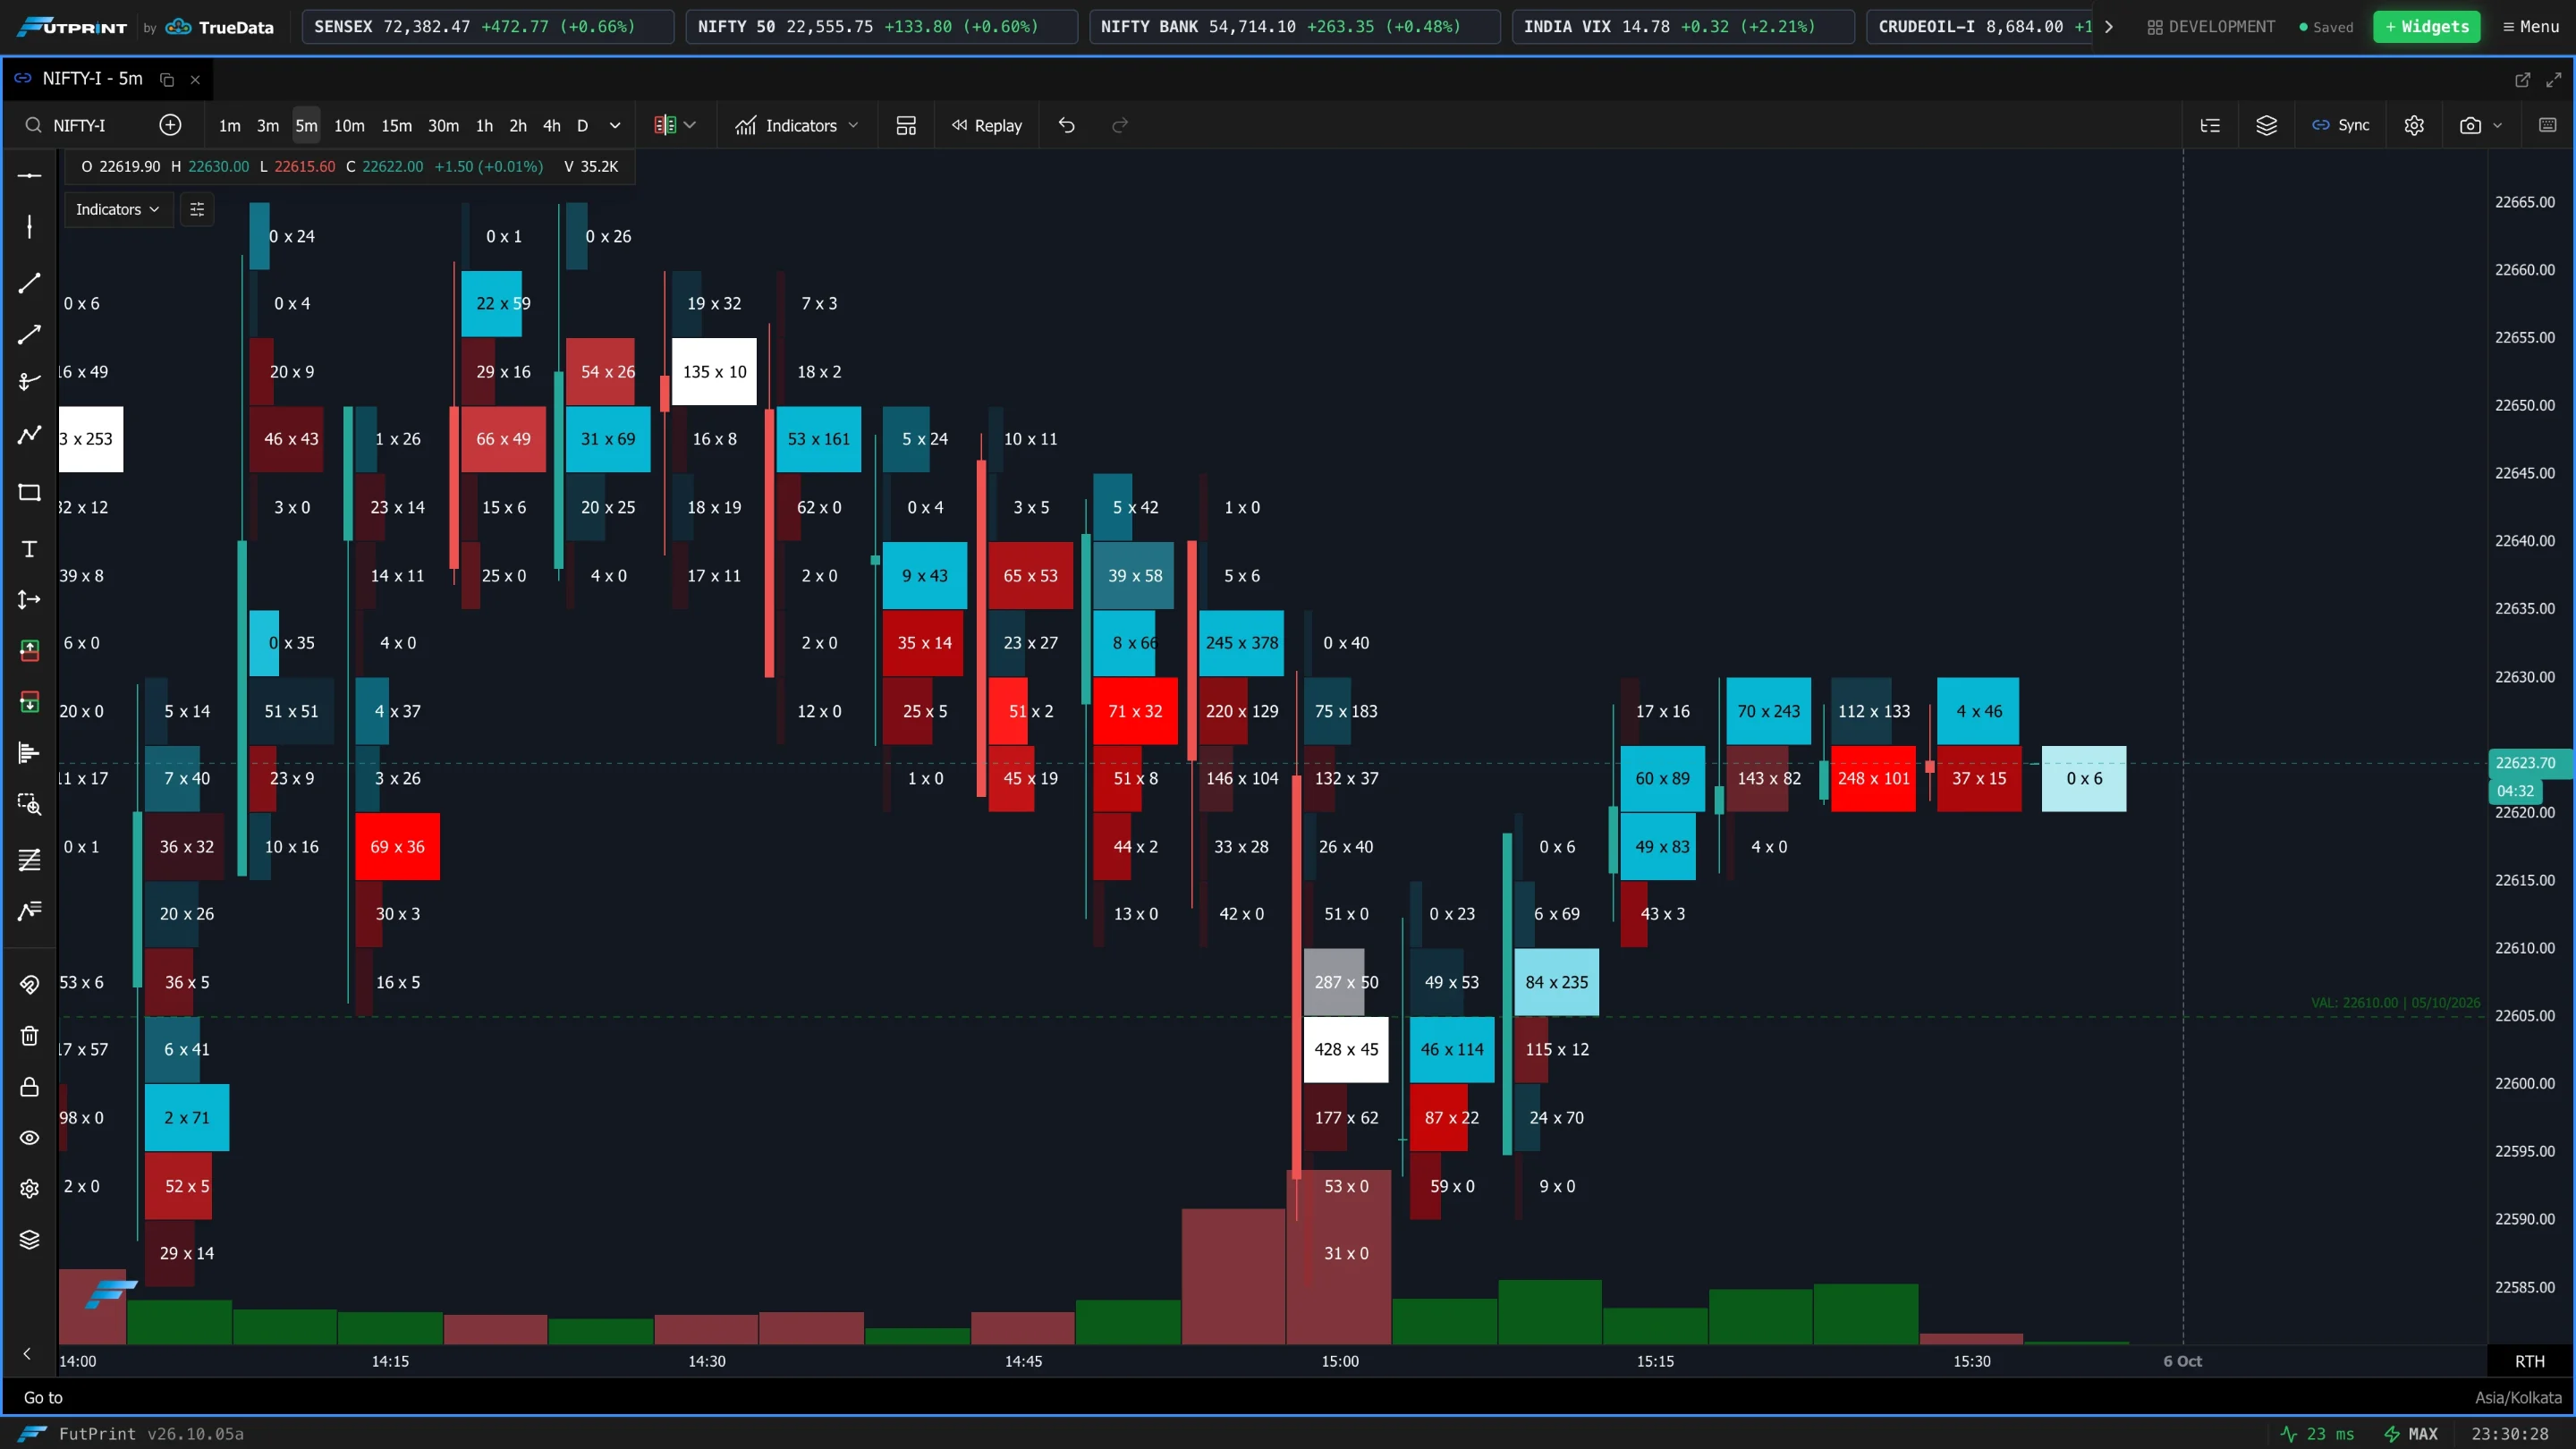
Manual Bin Size (ticks)
(shown when Bin Size Mode = Manual) The fixed number of ticks grouped into each footprint level. Smaller = more, finer rows; larger = fewer, coarser rows.
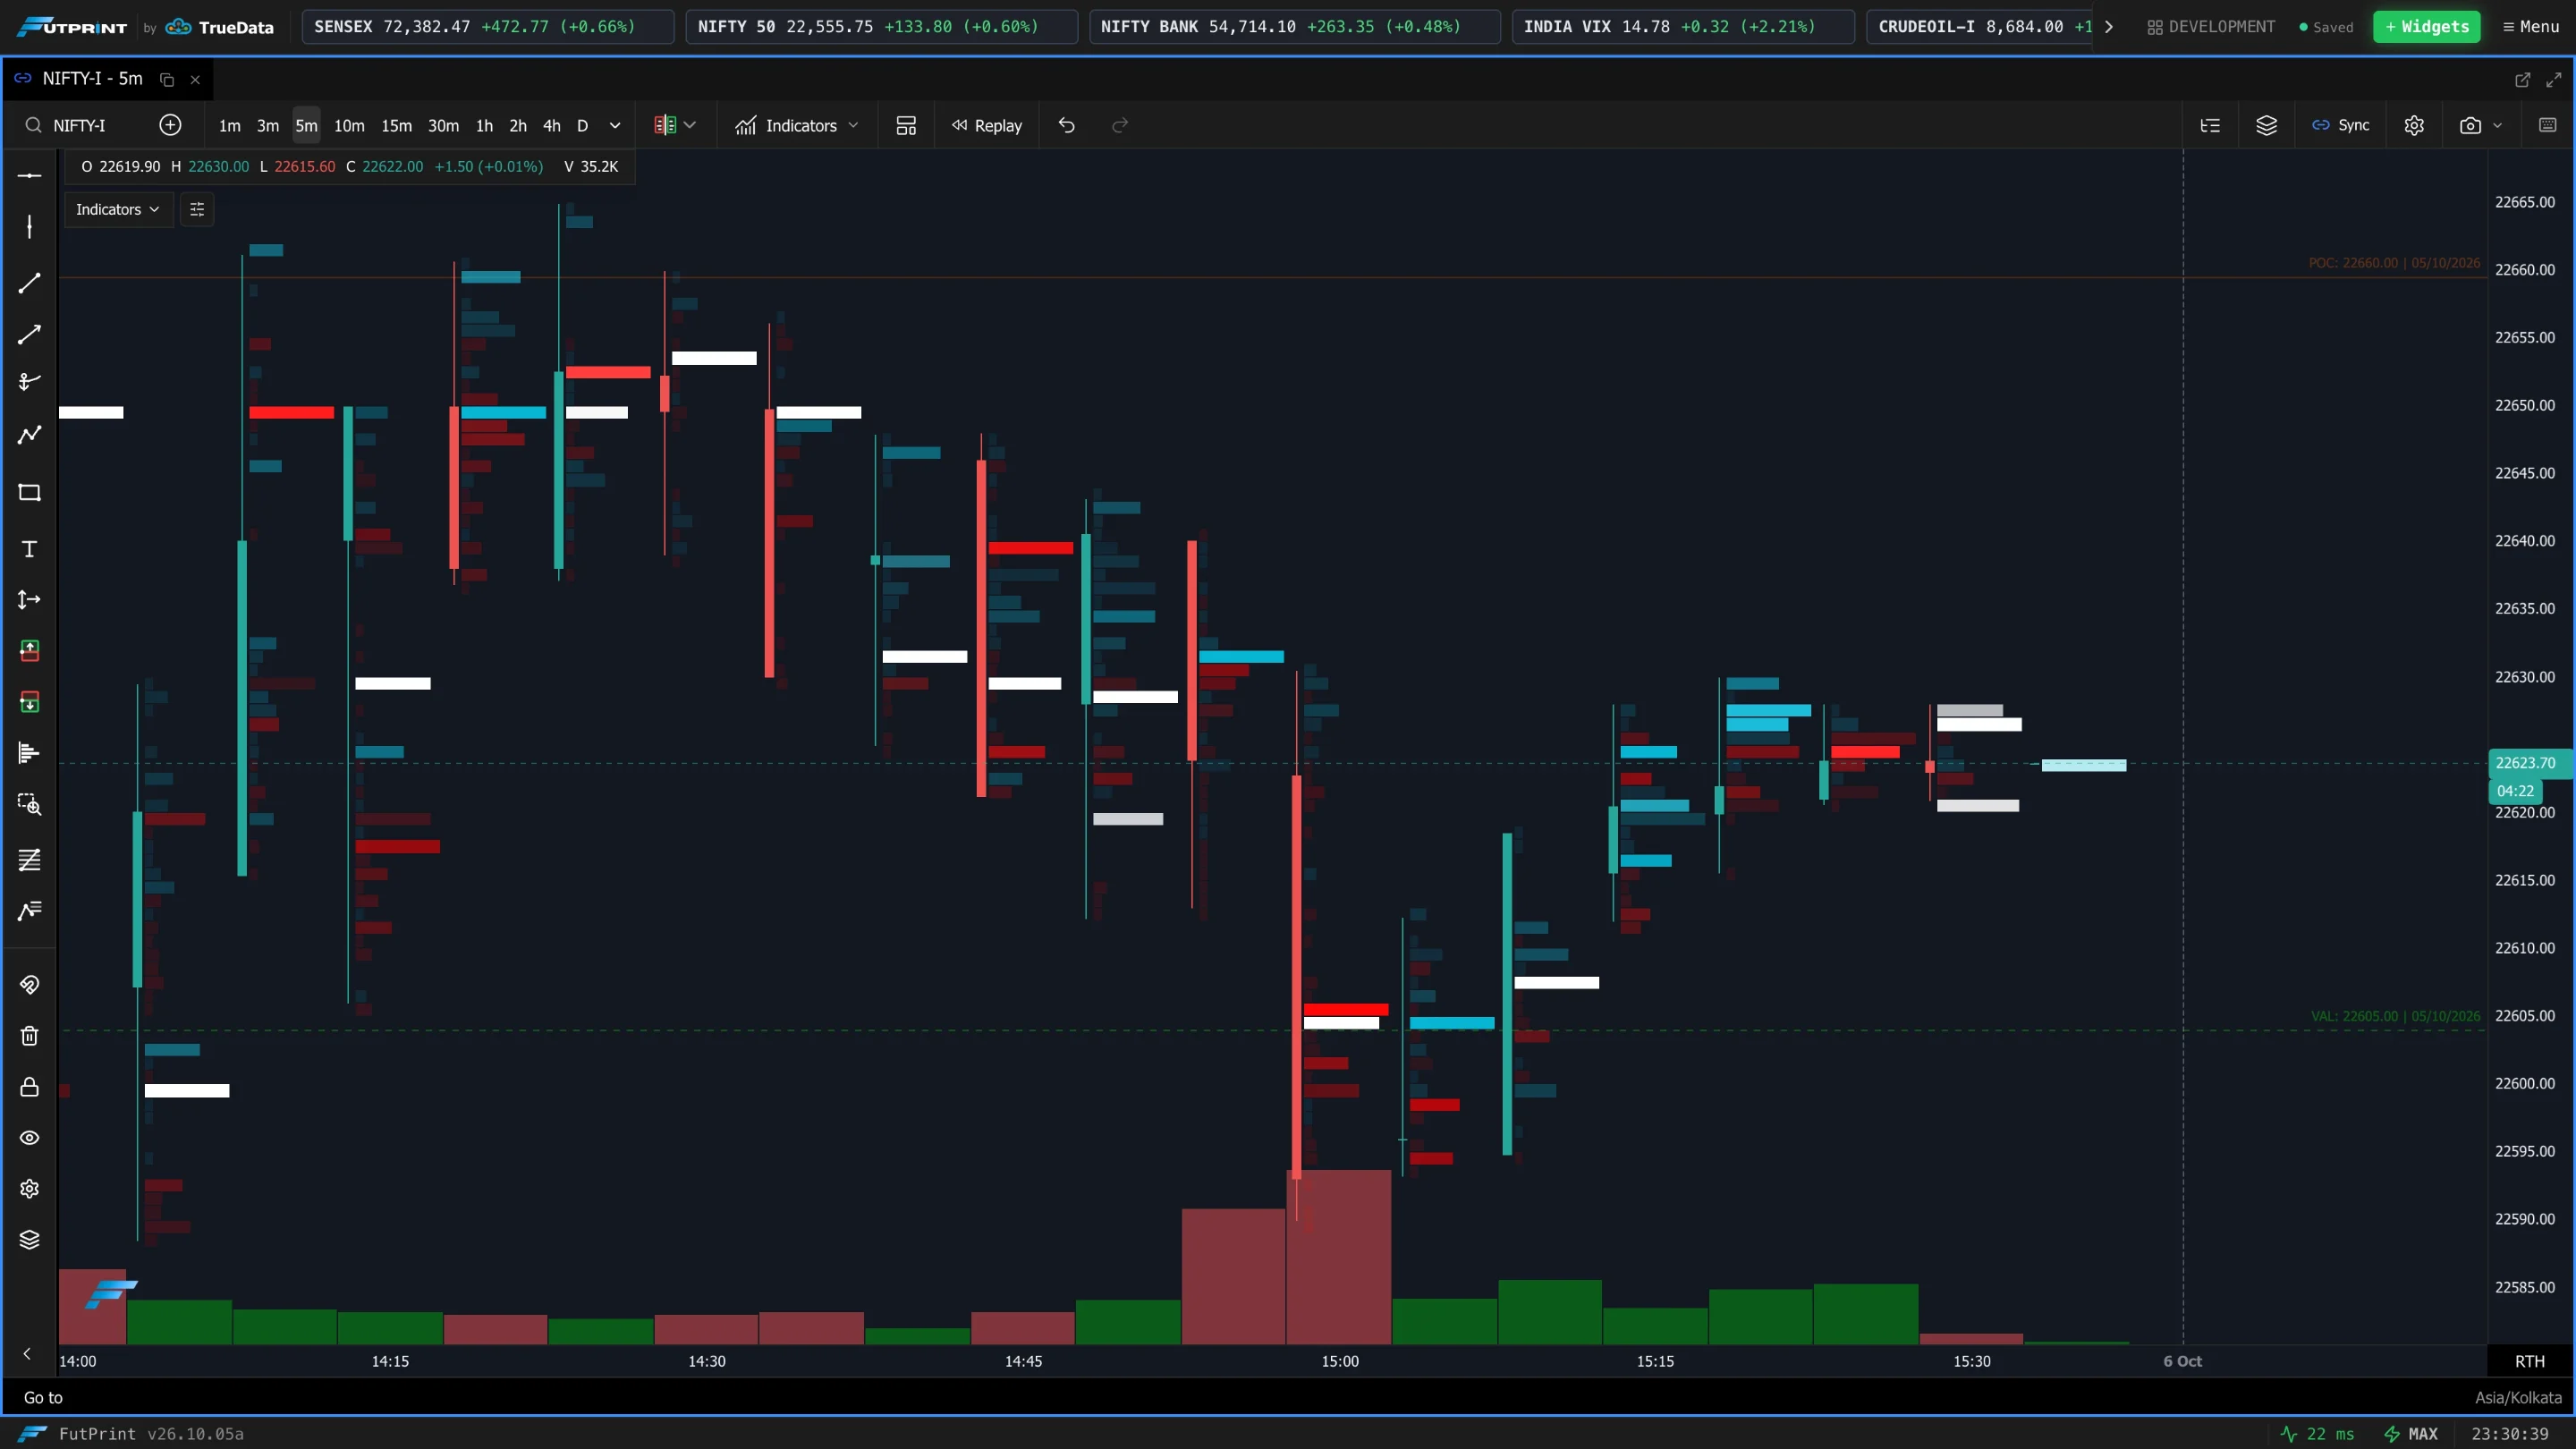
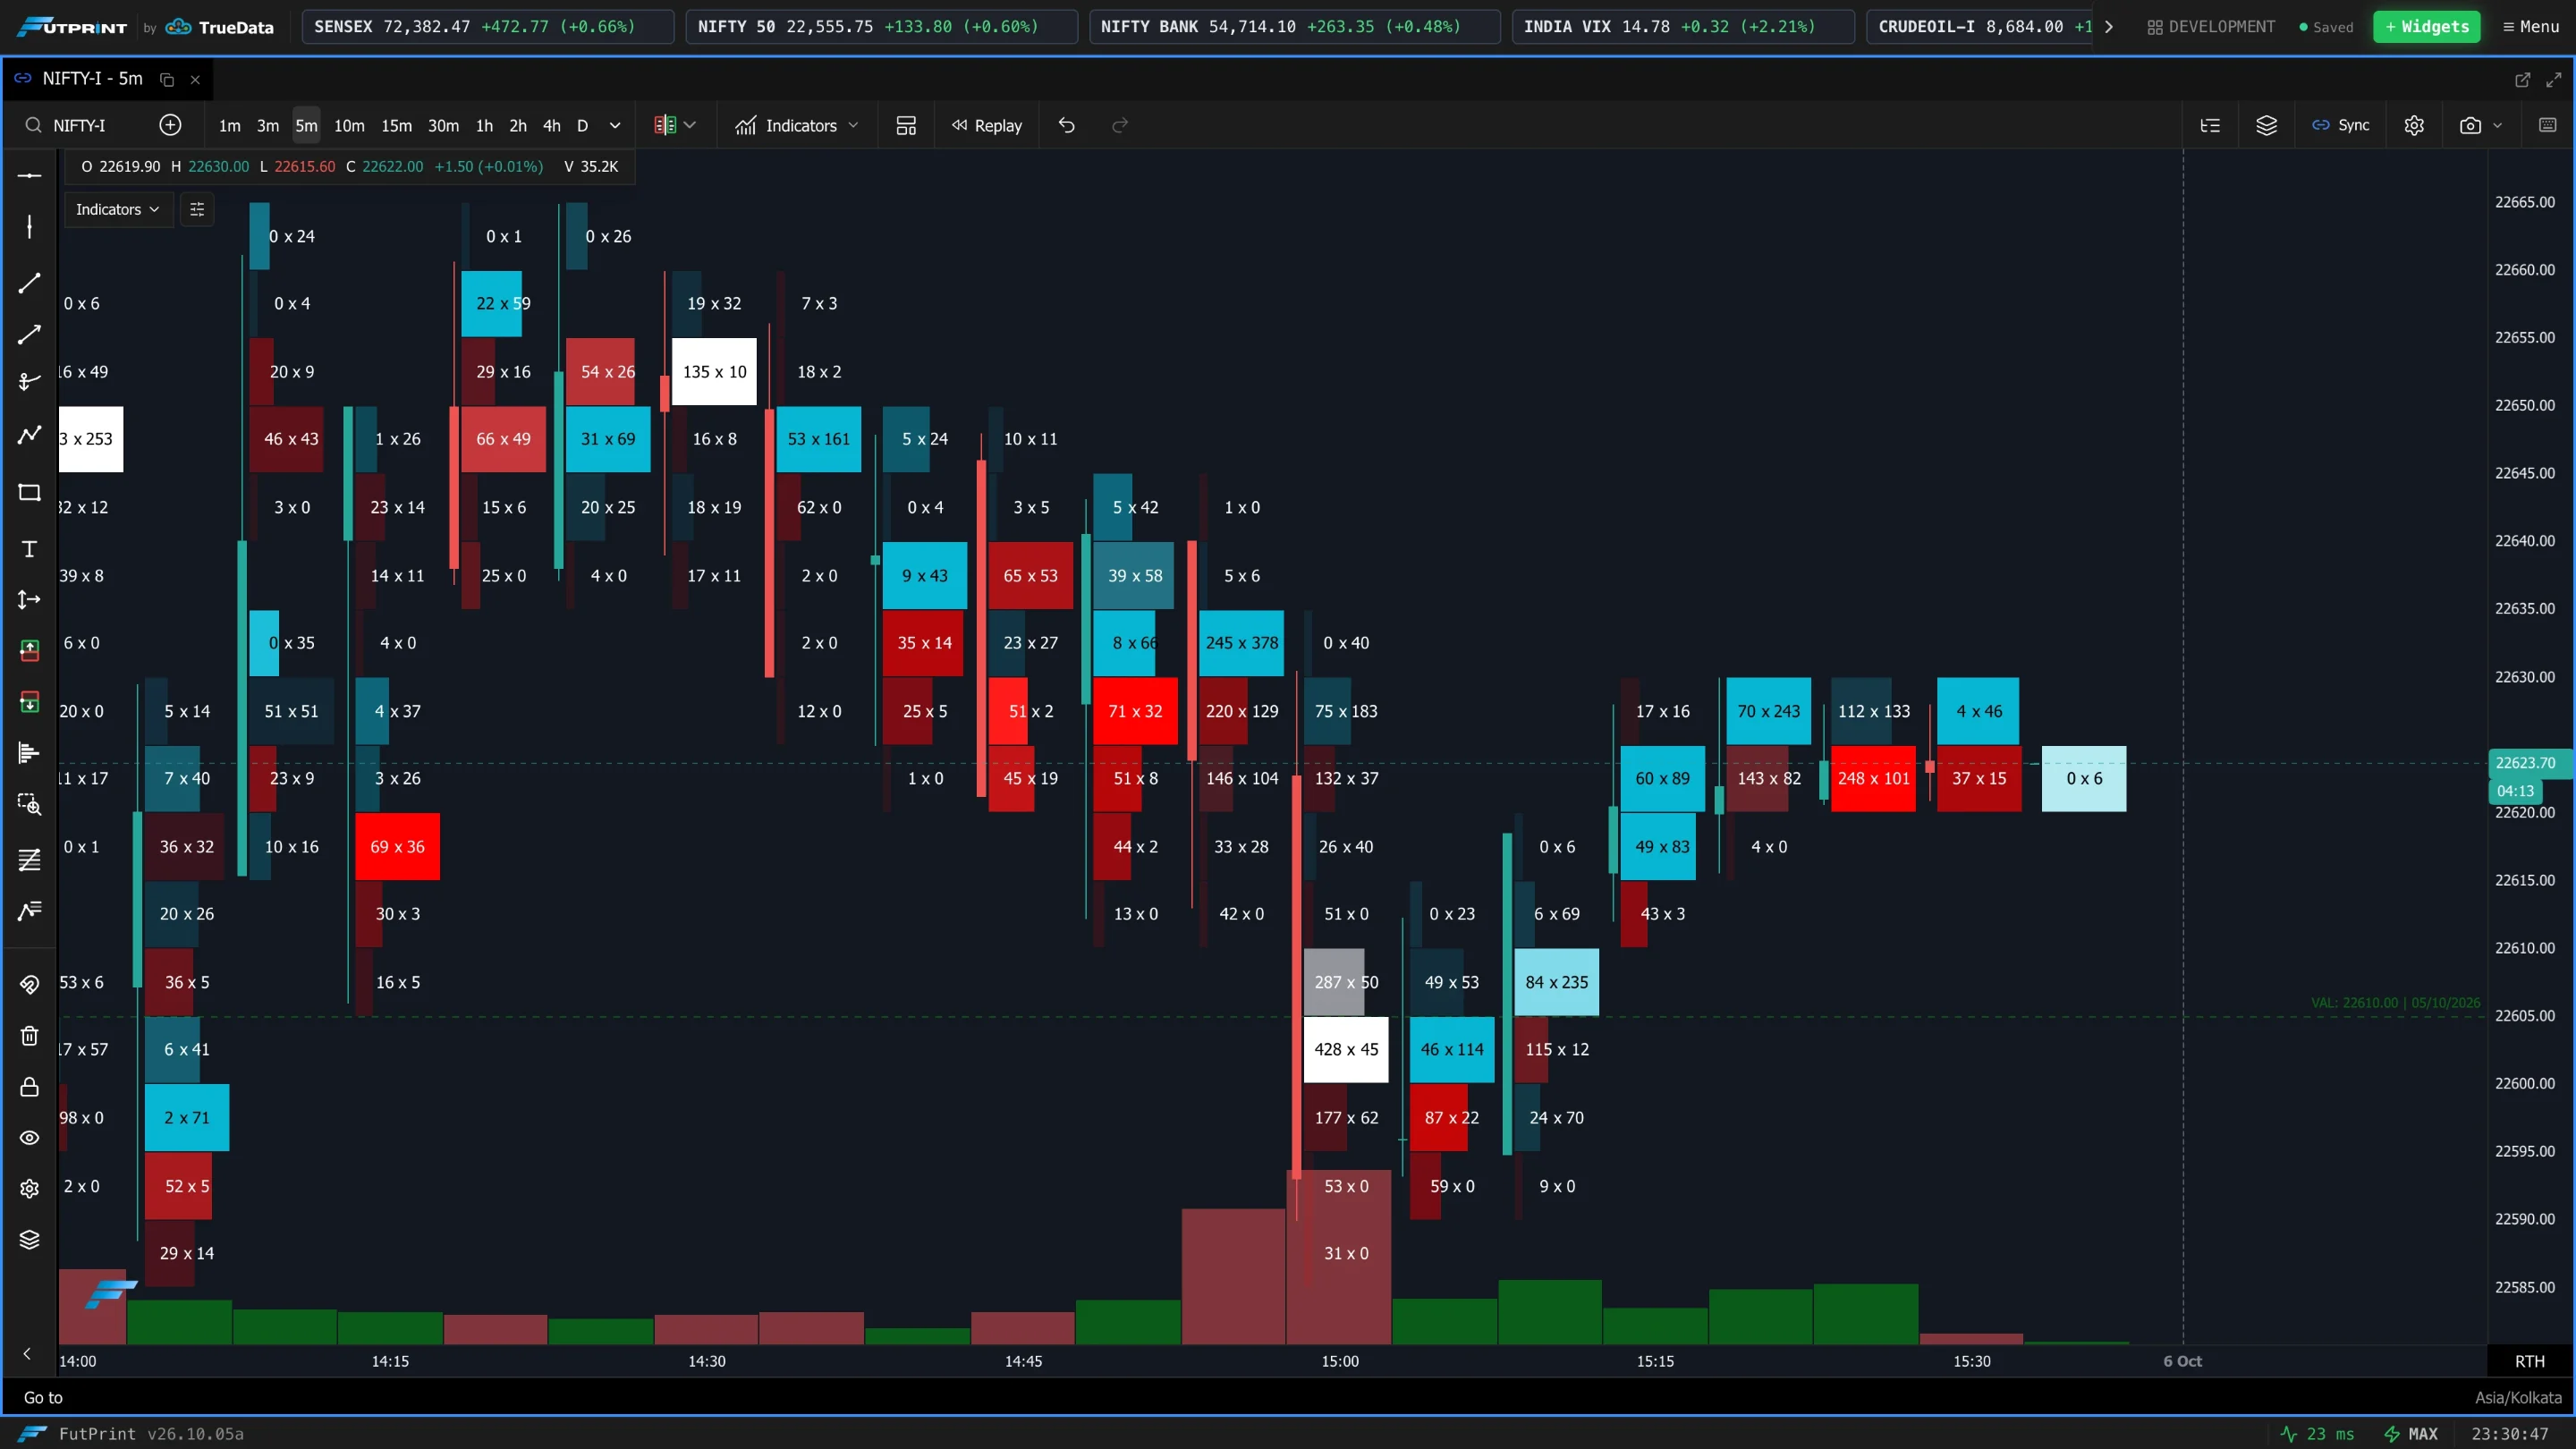
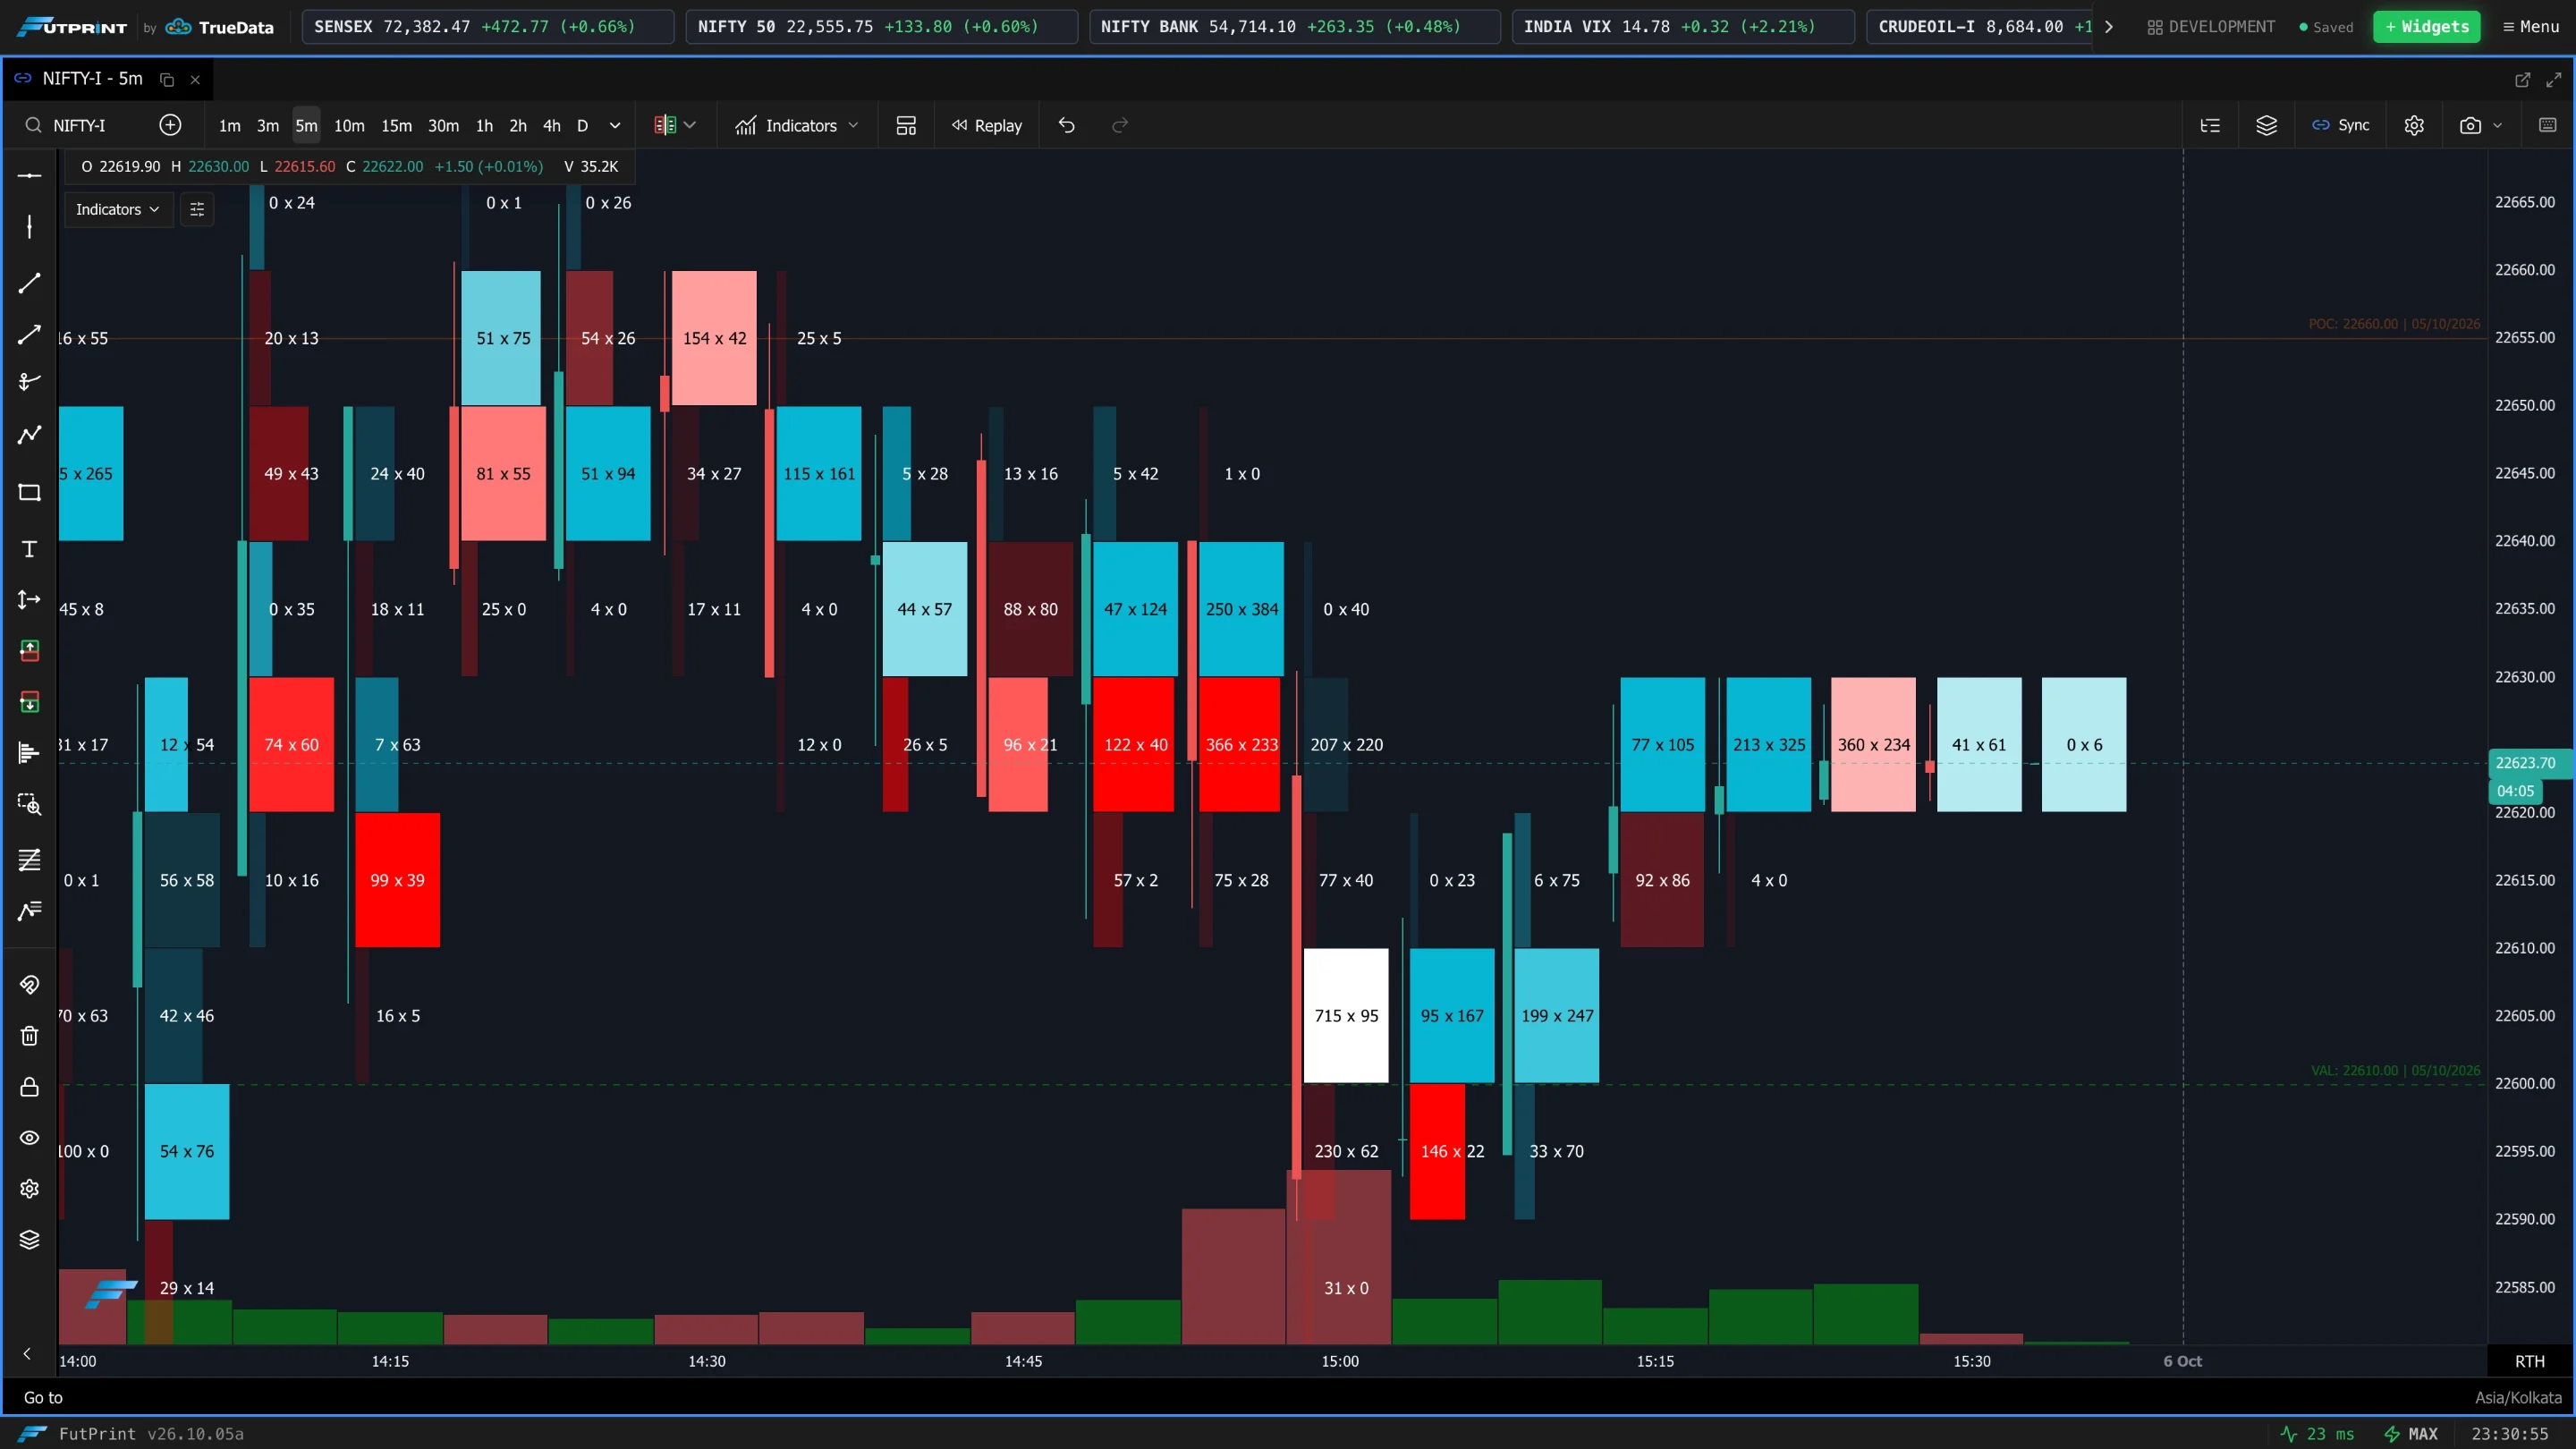
LTP-Based Bin Size
(shown when Bin Size Mode = LTP-Based Fixed) A read-out of the bin size currently chosen from the LTP brackets above. It updates automatically as price moves across brackets — there's nothing to set.
Format Volume (k/M)
Converts large volume numbers to an abbreviated form for readability — e.g. 1,200
becomes 1.2k and 3,500,000 becomes 3.5M. Recommended on high-volume
instruments.
Lot Size
The contract/lot size for the instrument, used to convert displayed volume into
actual contracts. For example, with lot size 50, a displayed 1.2k represents
1,200 × 50 = 60,000 contracts. Set this correctly for accurate volume figures.
Display Style
Controls the shape and layout of each footprint candle.
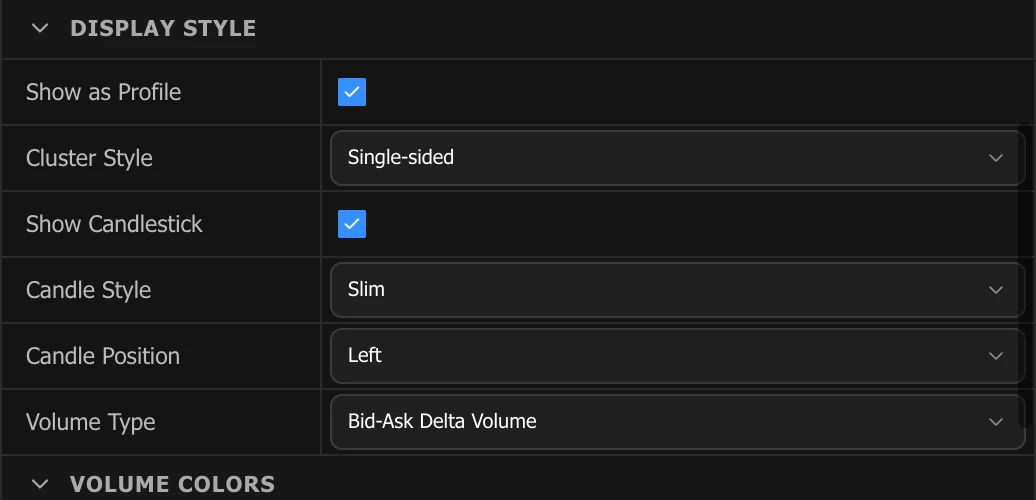
Show as Profile
Displays footprint data as a volume profile histogram instead of individual blocks — a cleaner, traditional profile of volume across price. Good for spotting key levels and overall distribution.
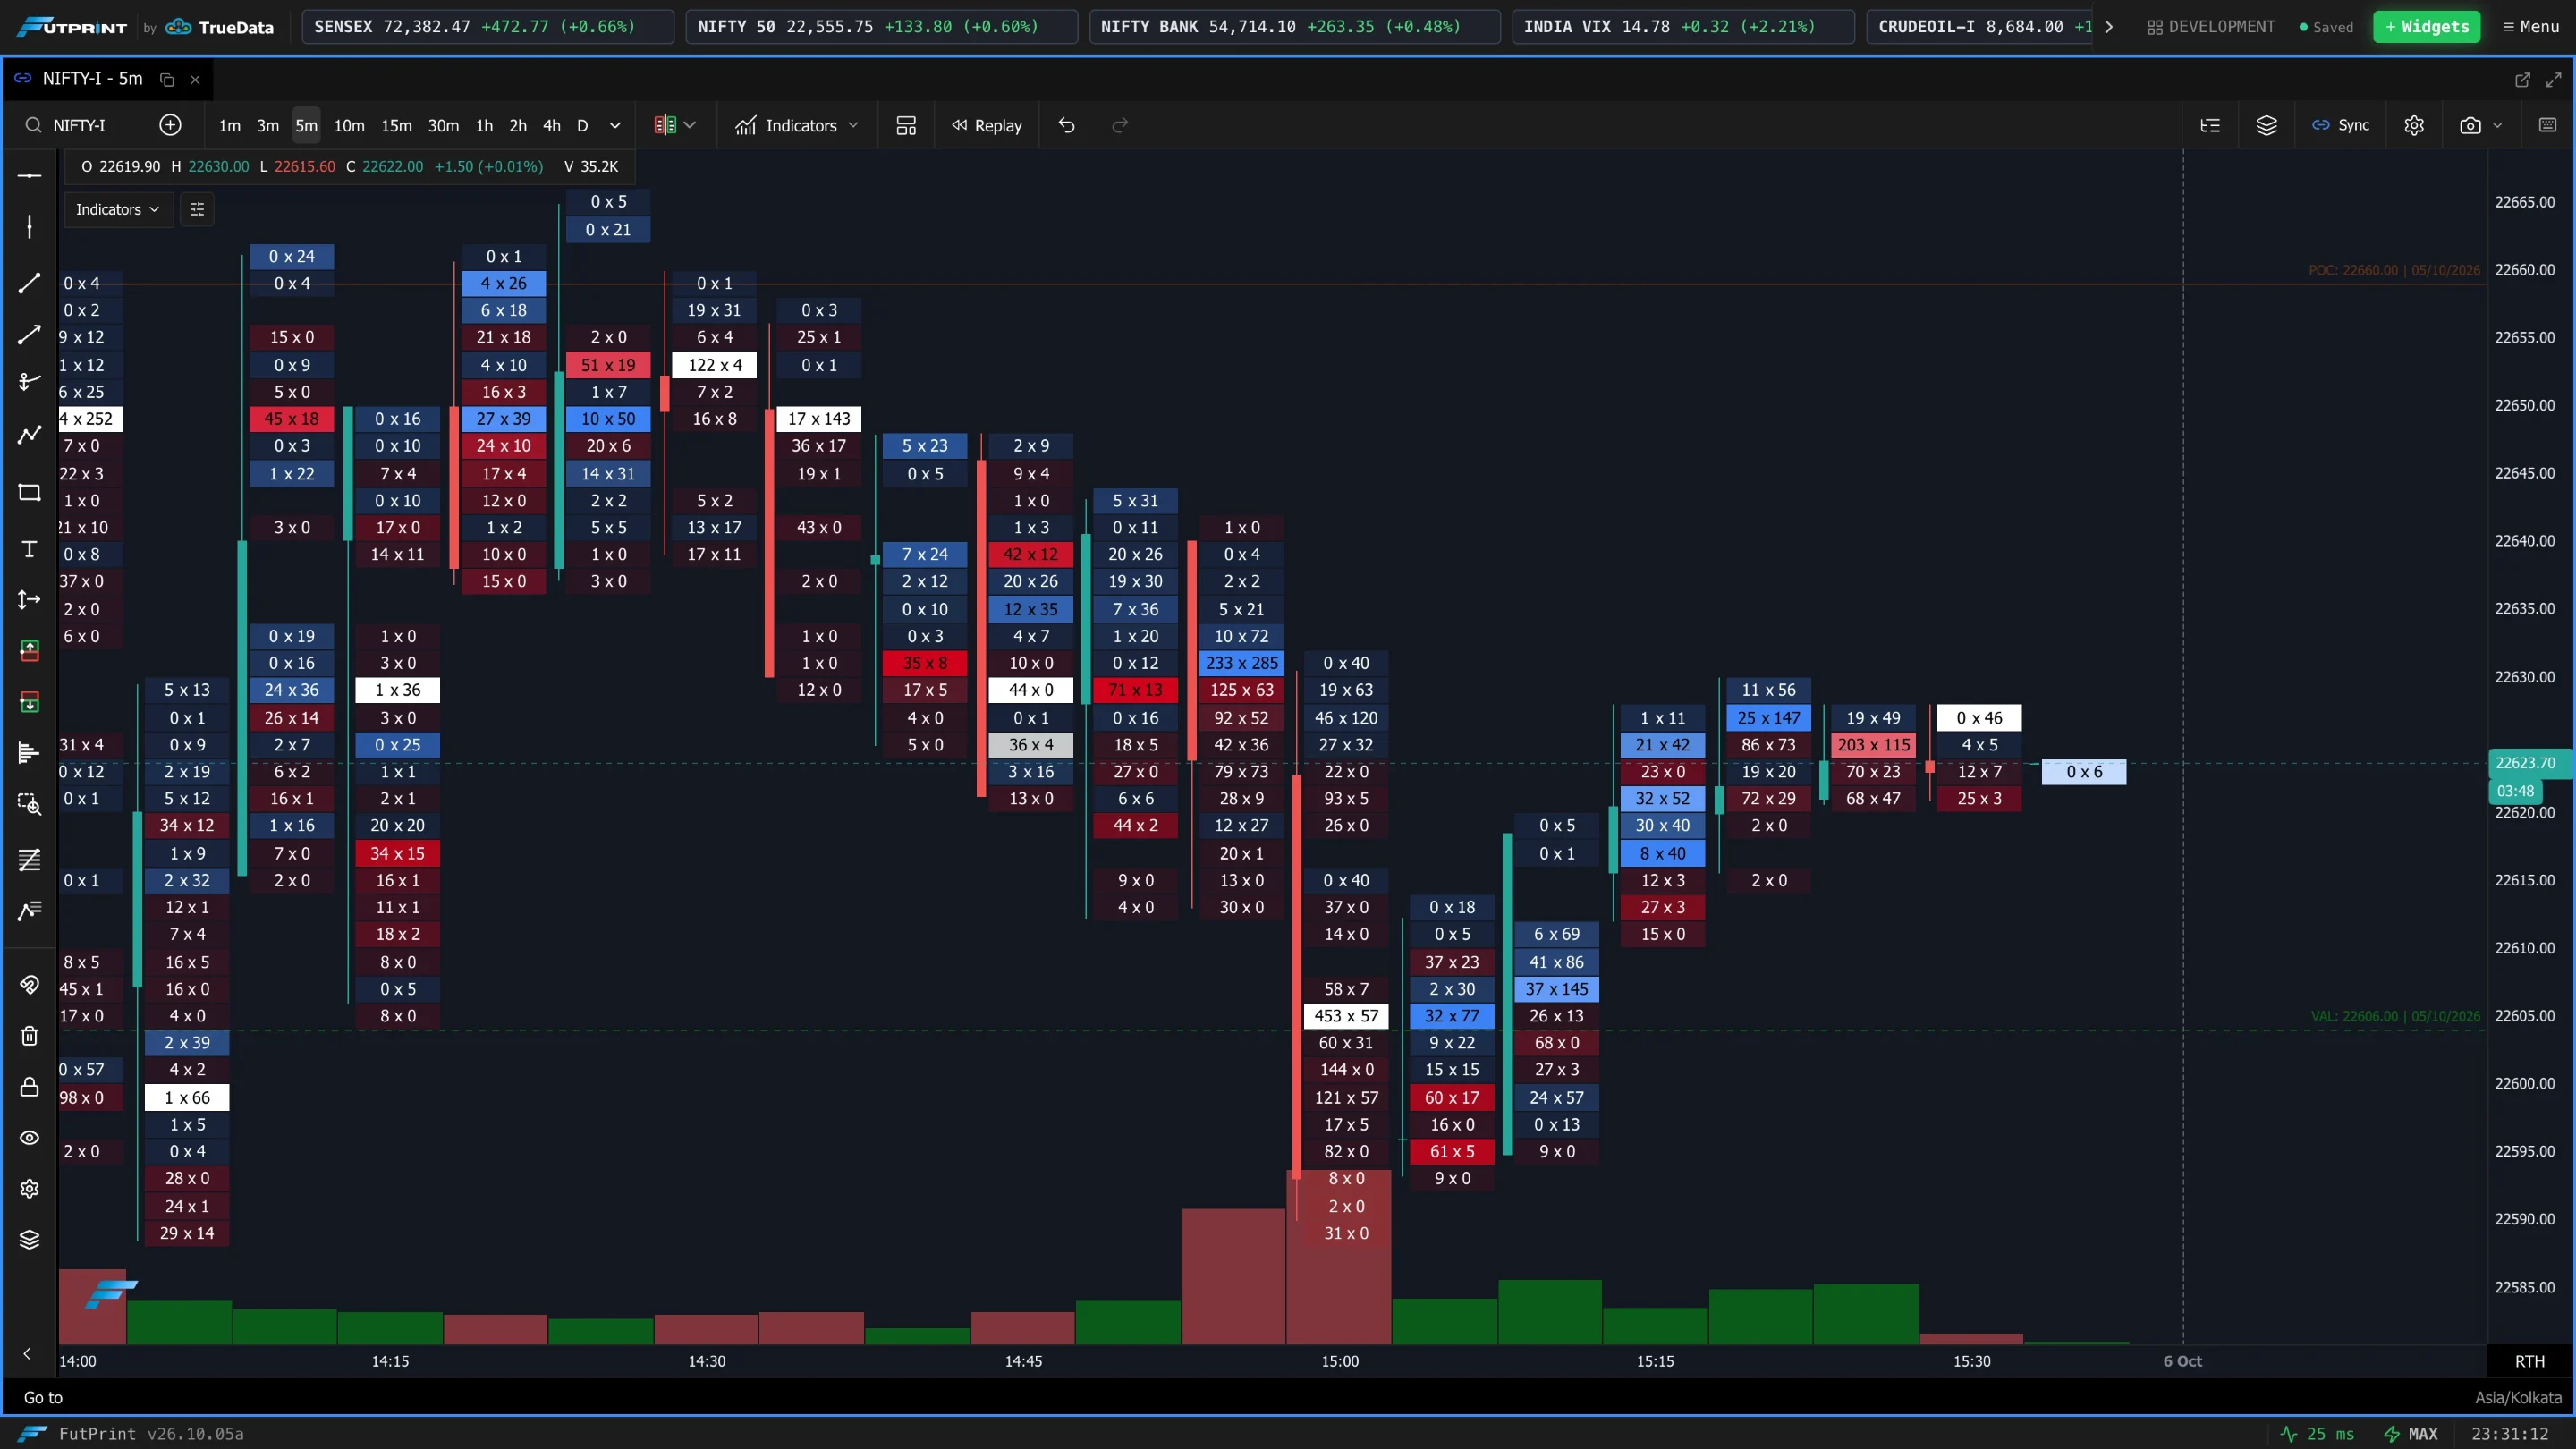
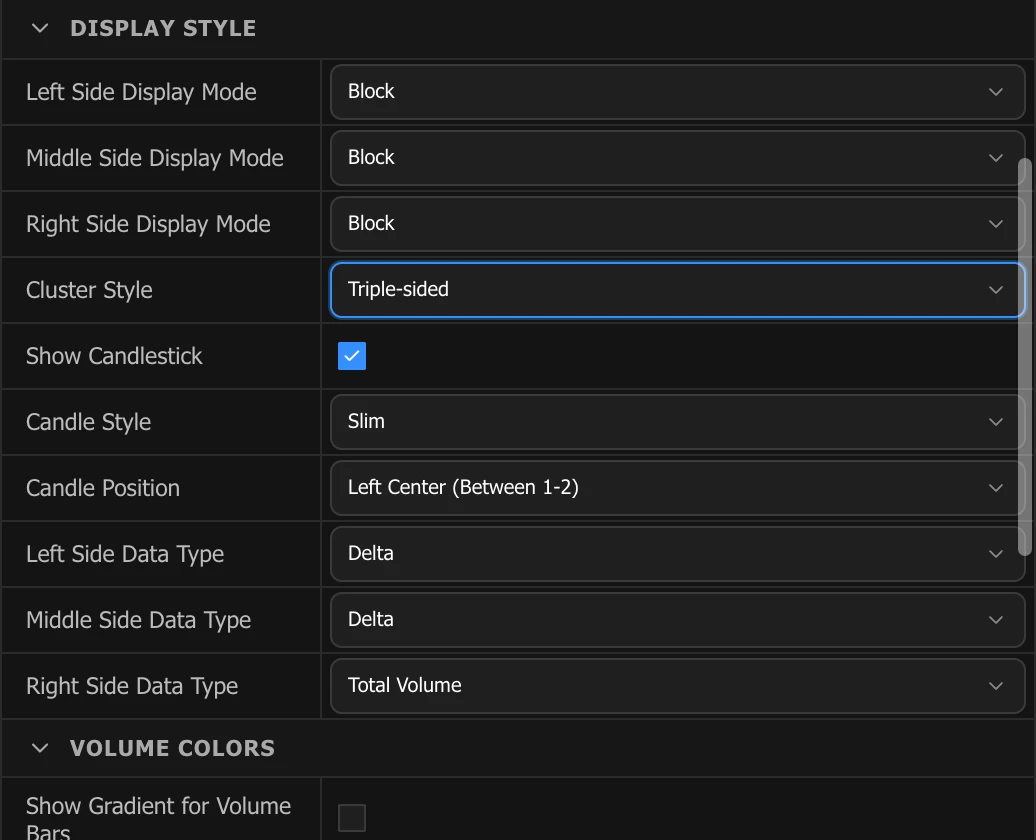
Left / Middle / Right Side Display Mode
Each column of the footprint can be drawn independently as:
- Block — individual per-level volume blocks (classic footprint).
- Profile — horizontal profile bars.
- Histogram — traditional volume-profile bars.
The Middle mode only applies to triple-sided clusters (below).
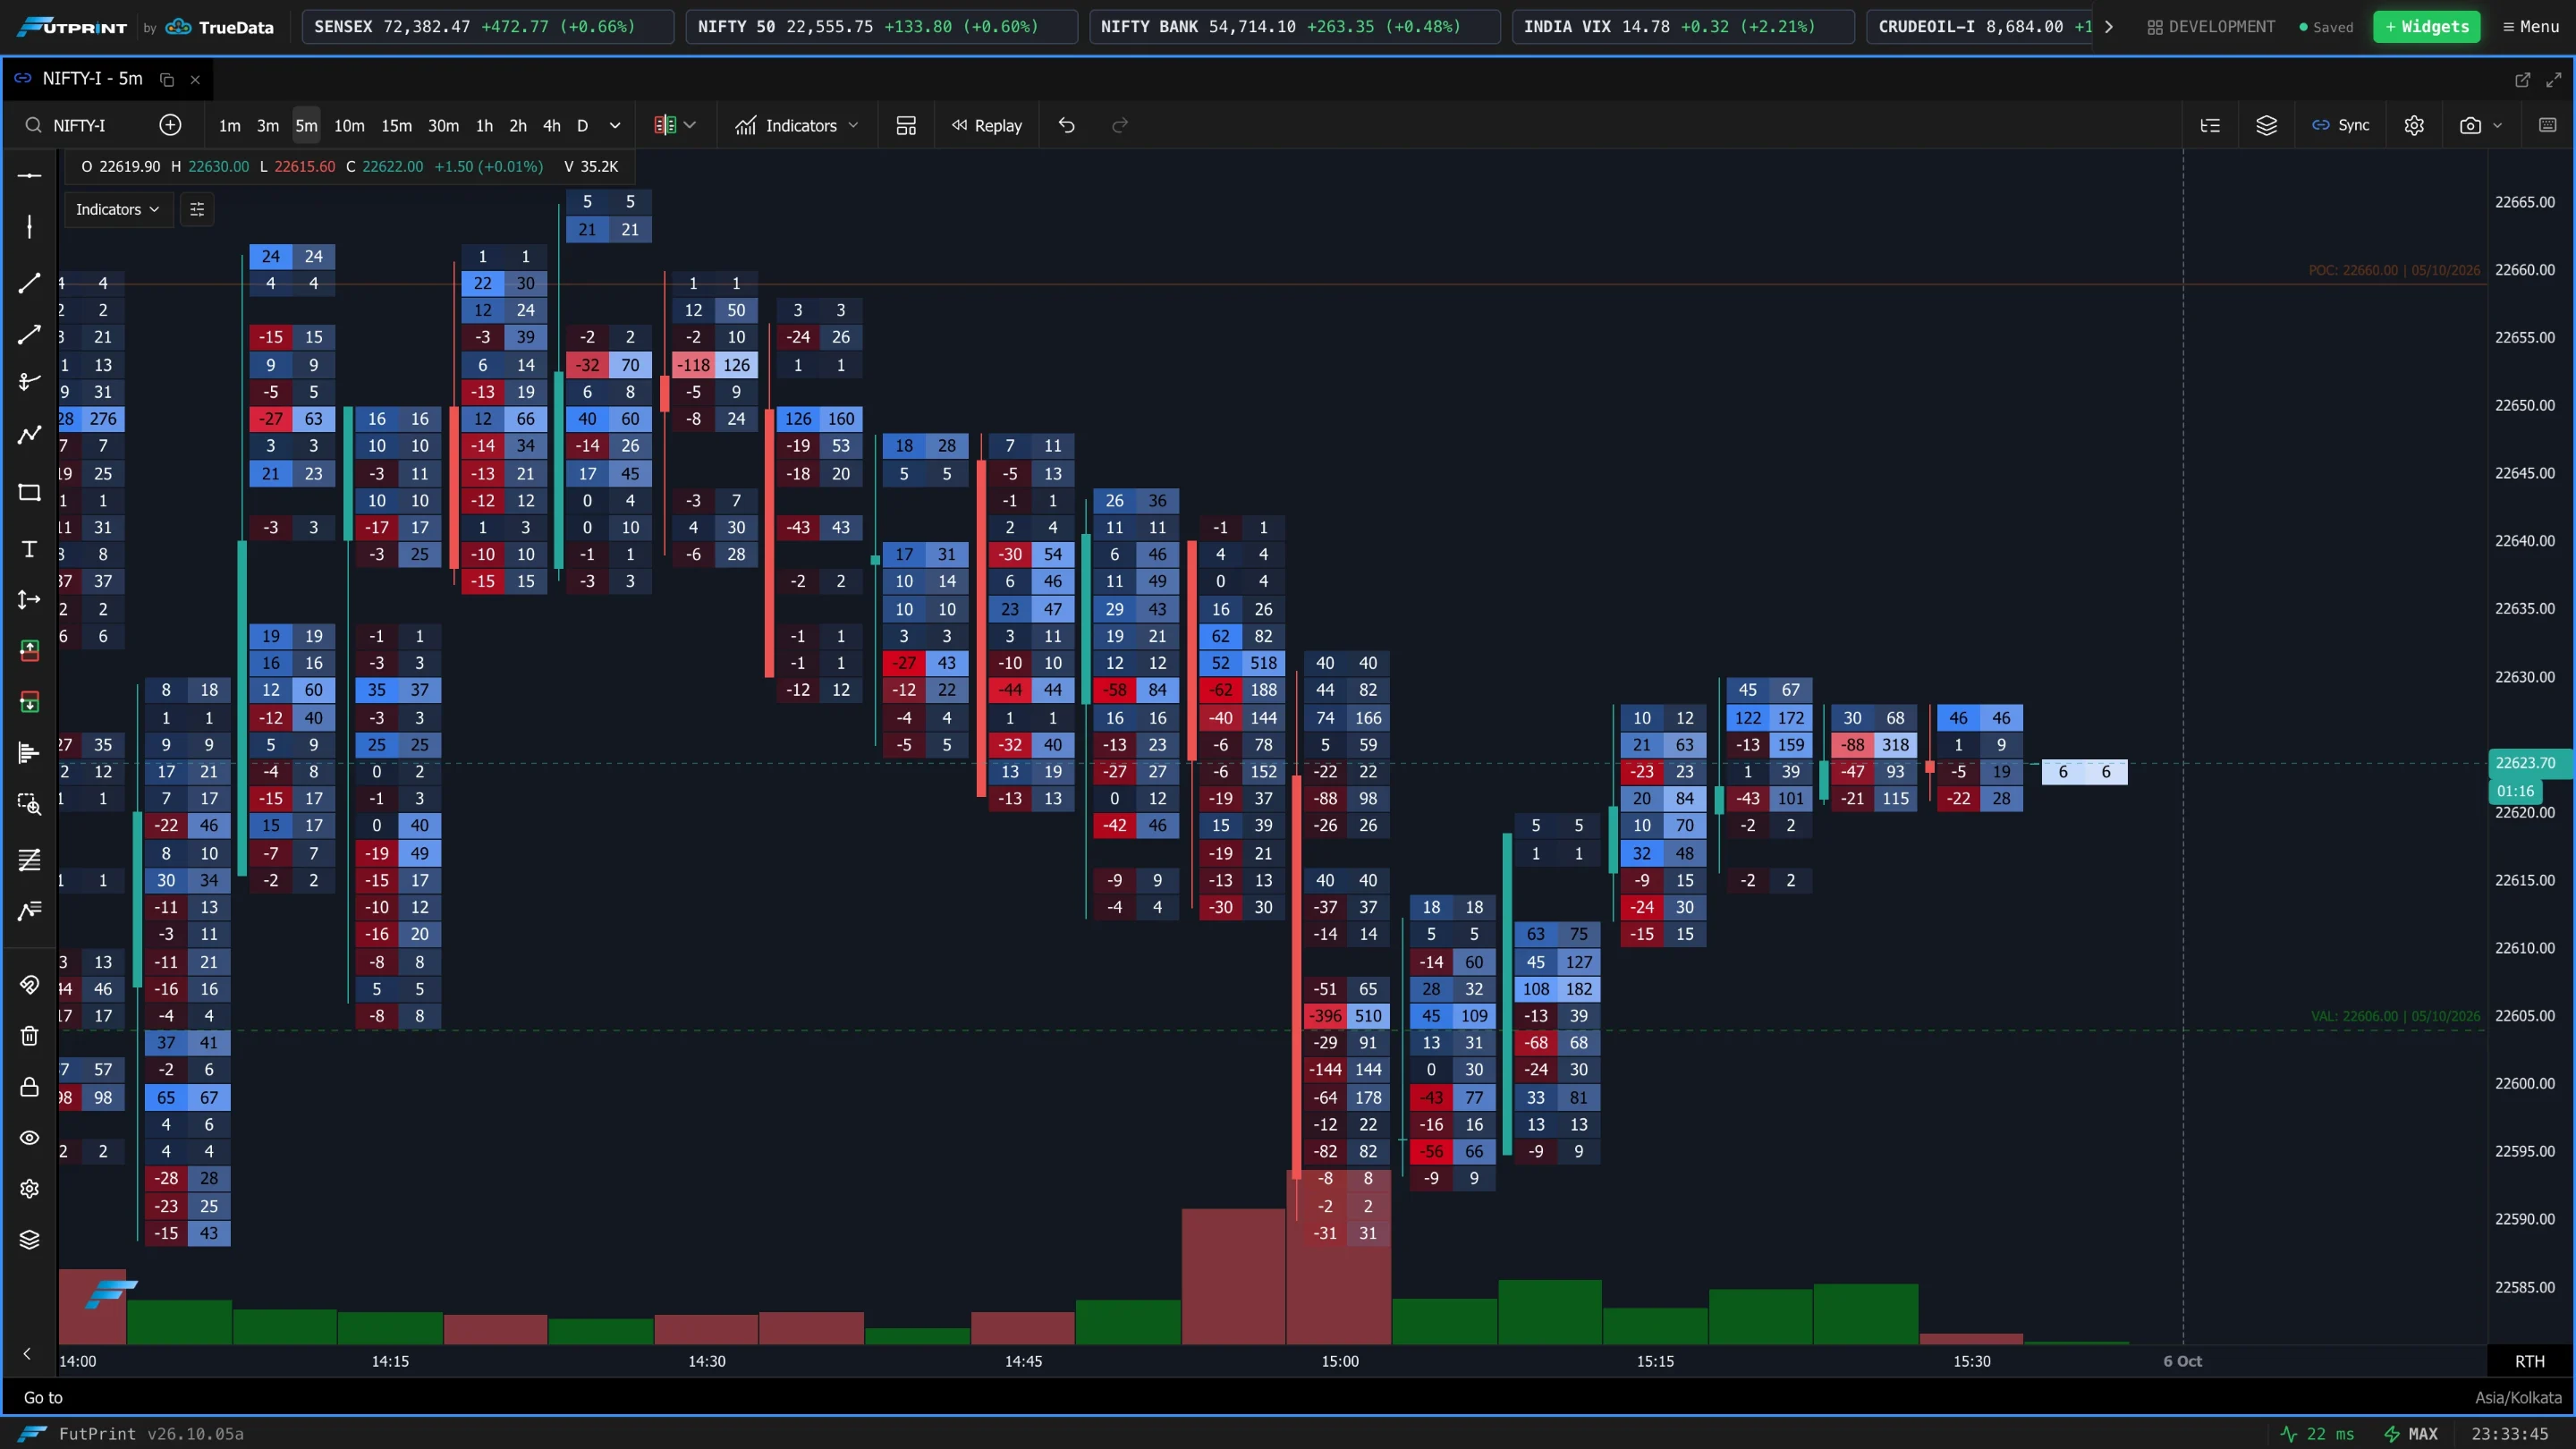
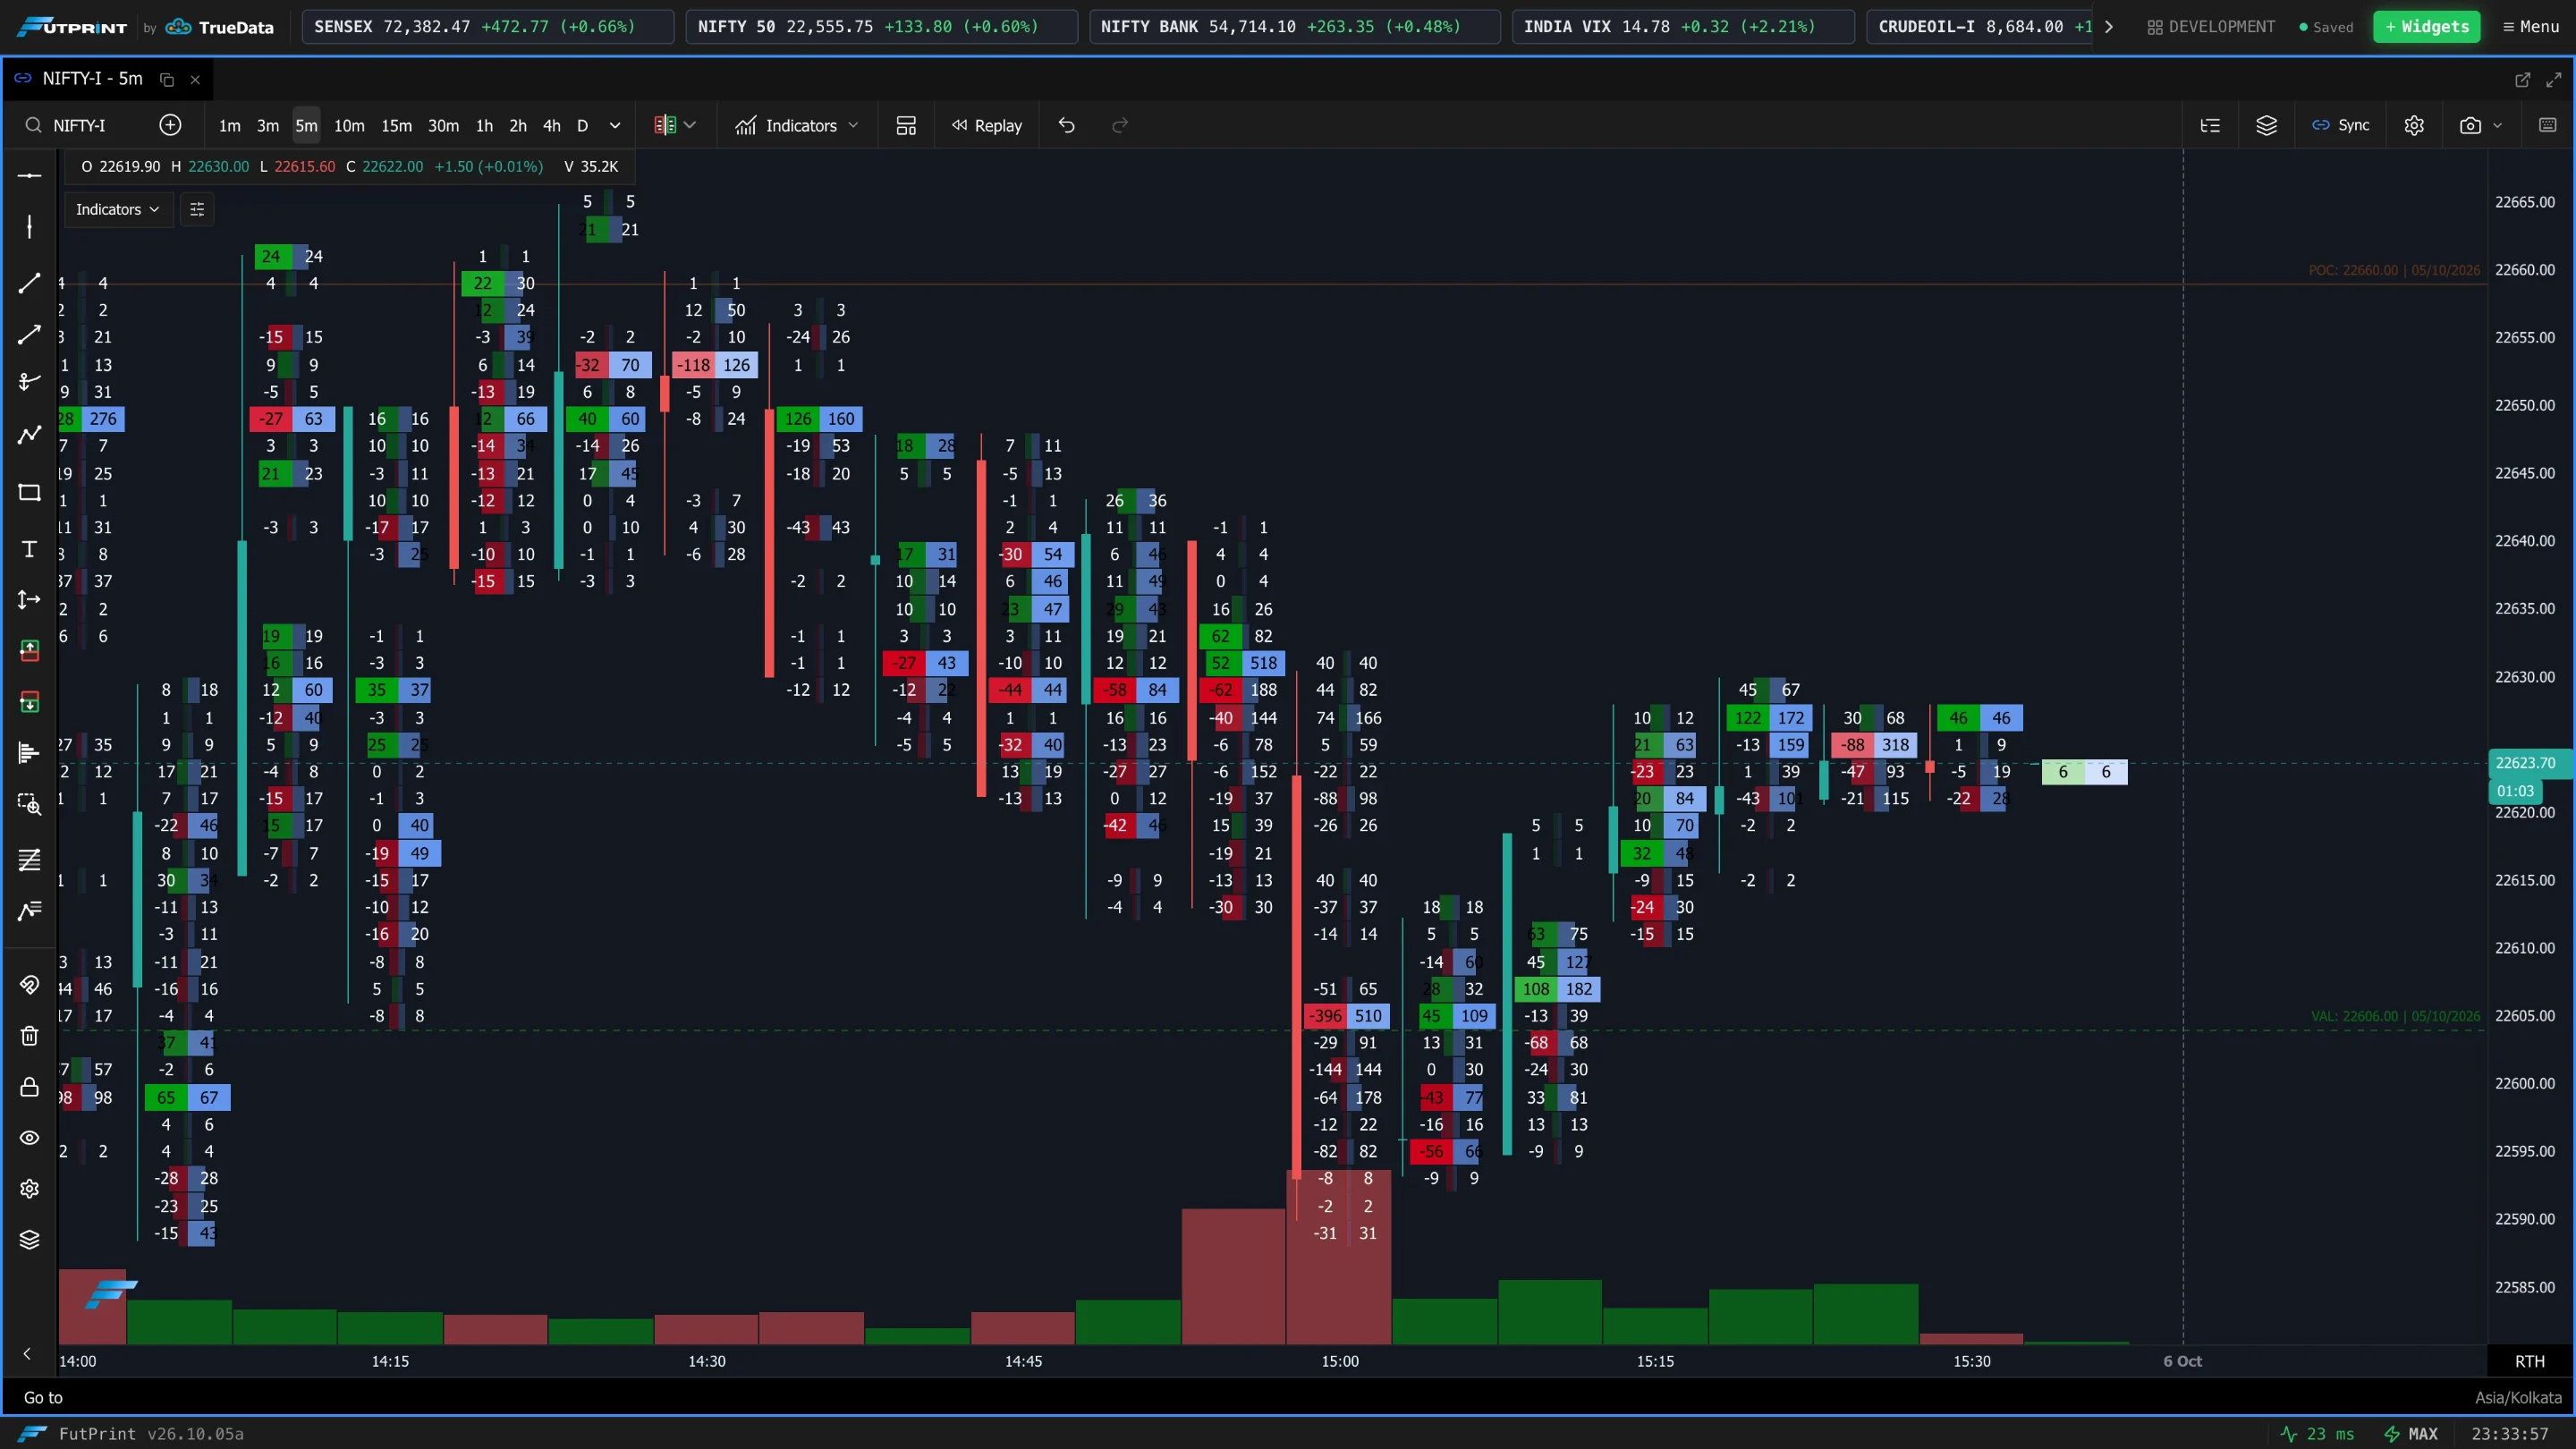
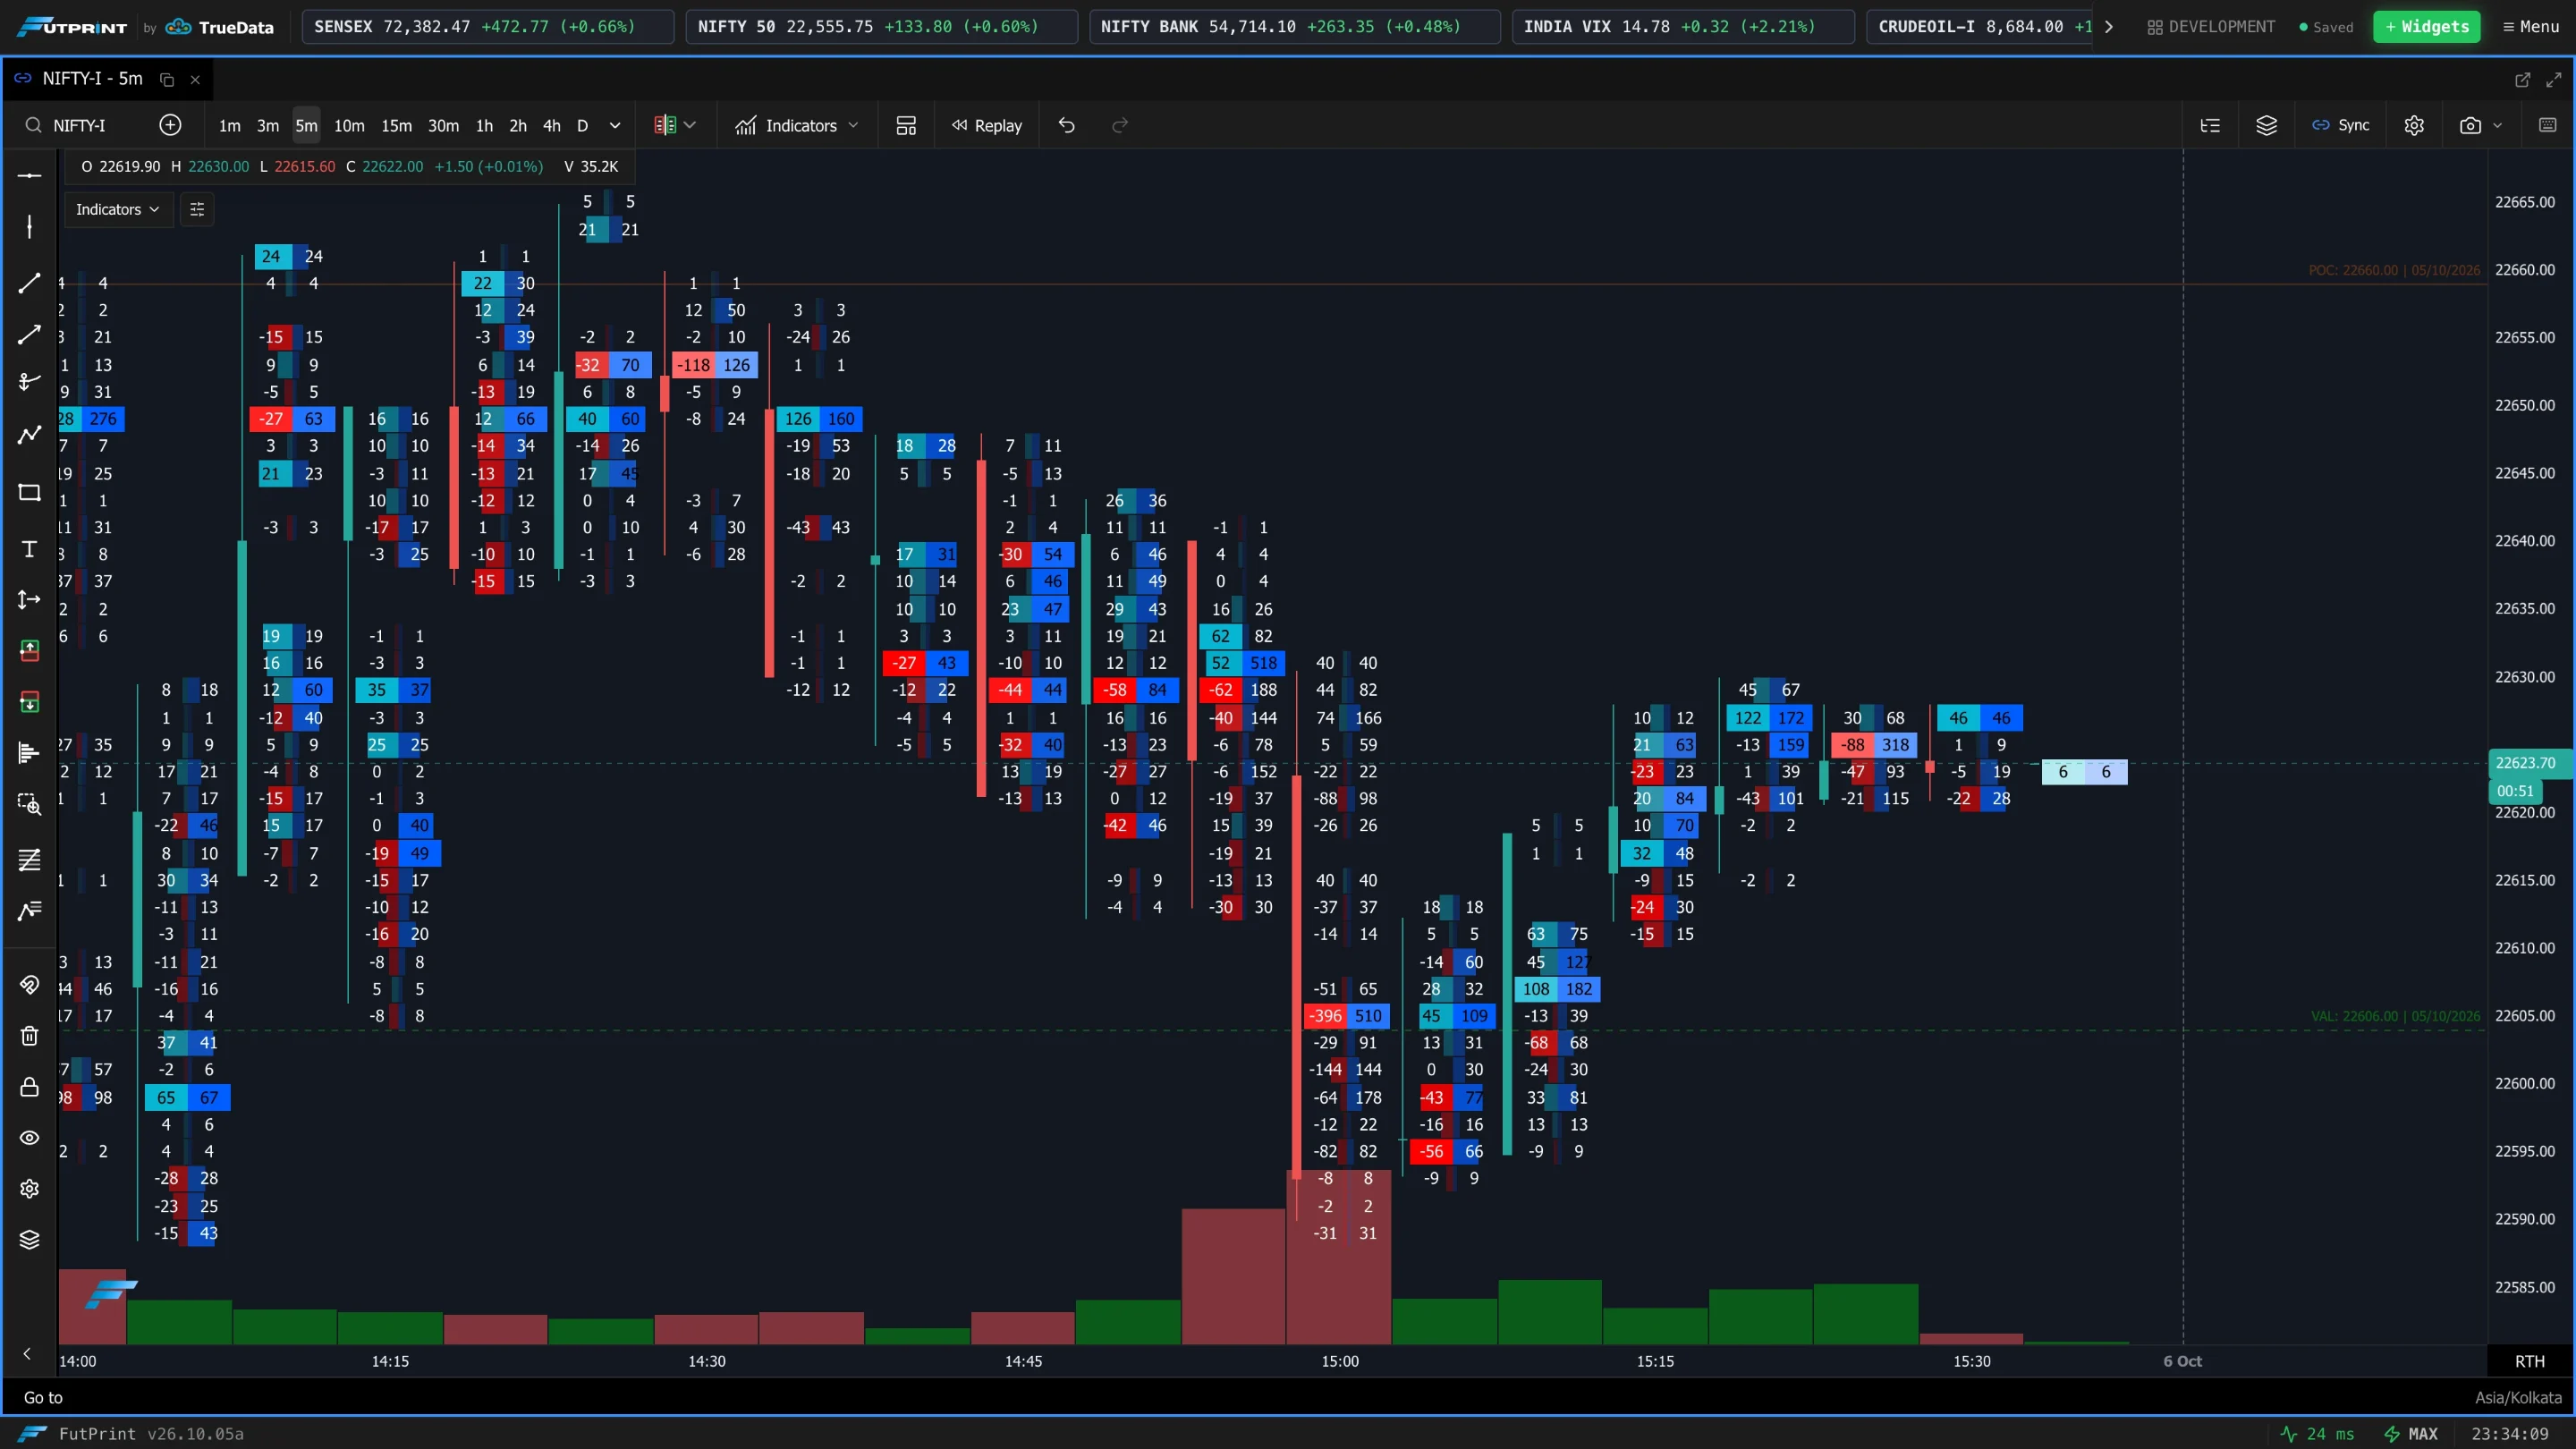
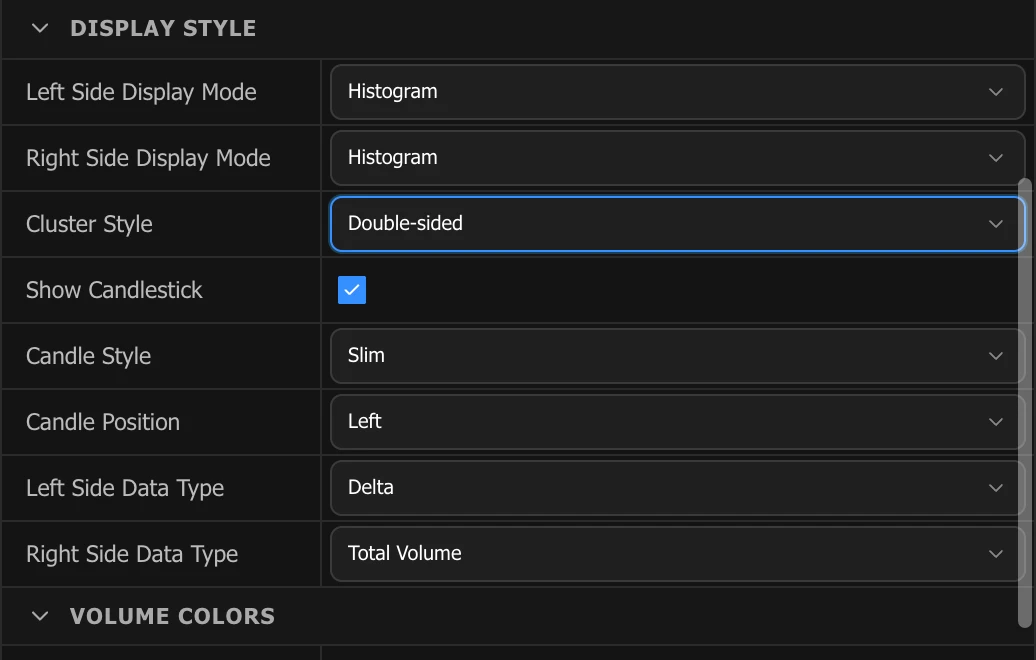
Cluster Style
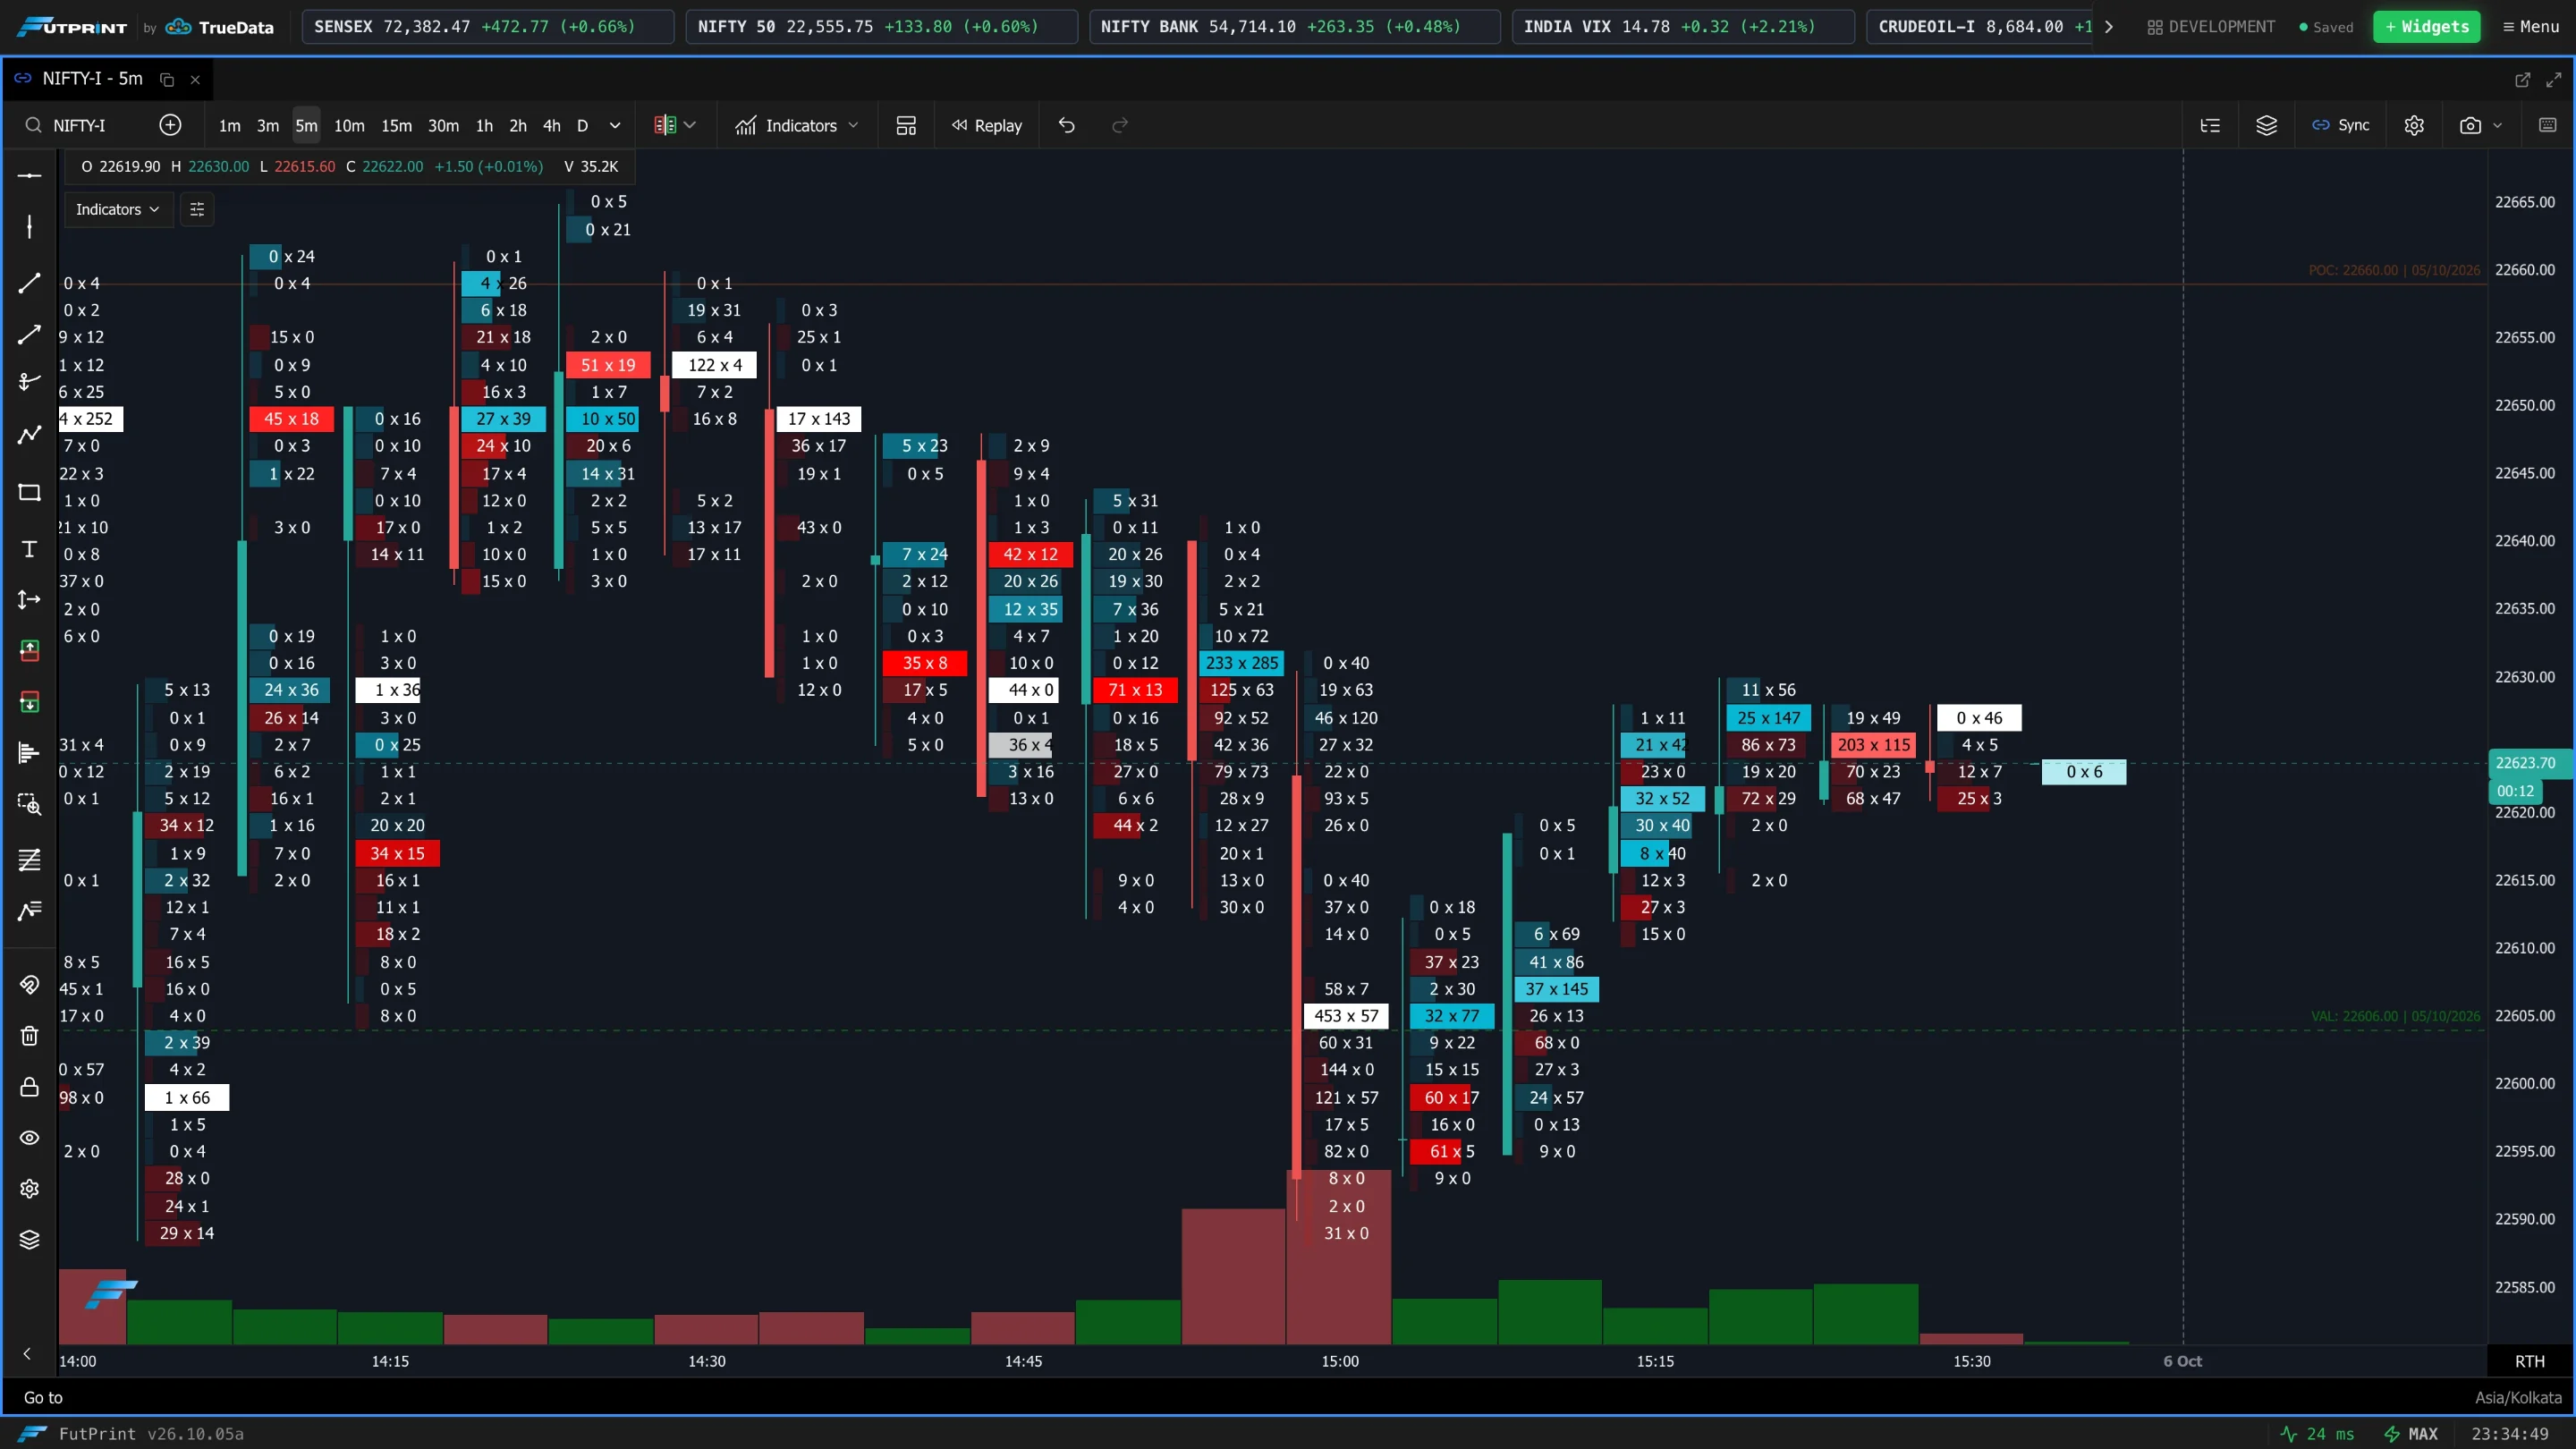
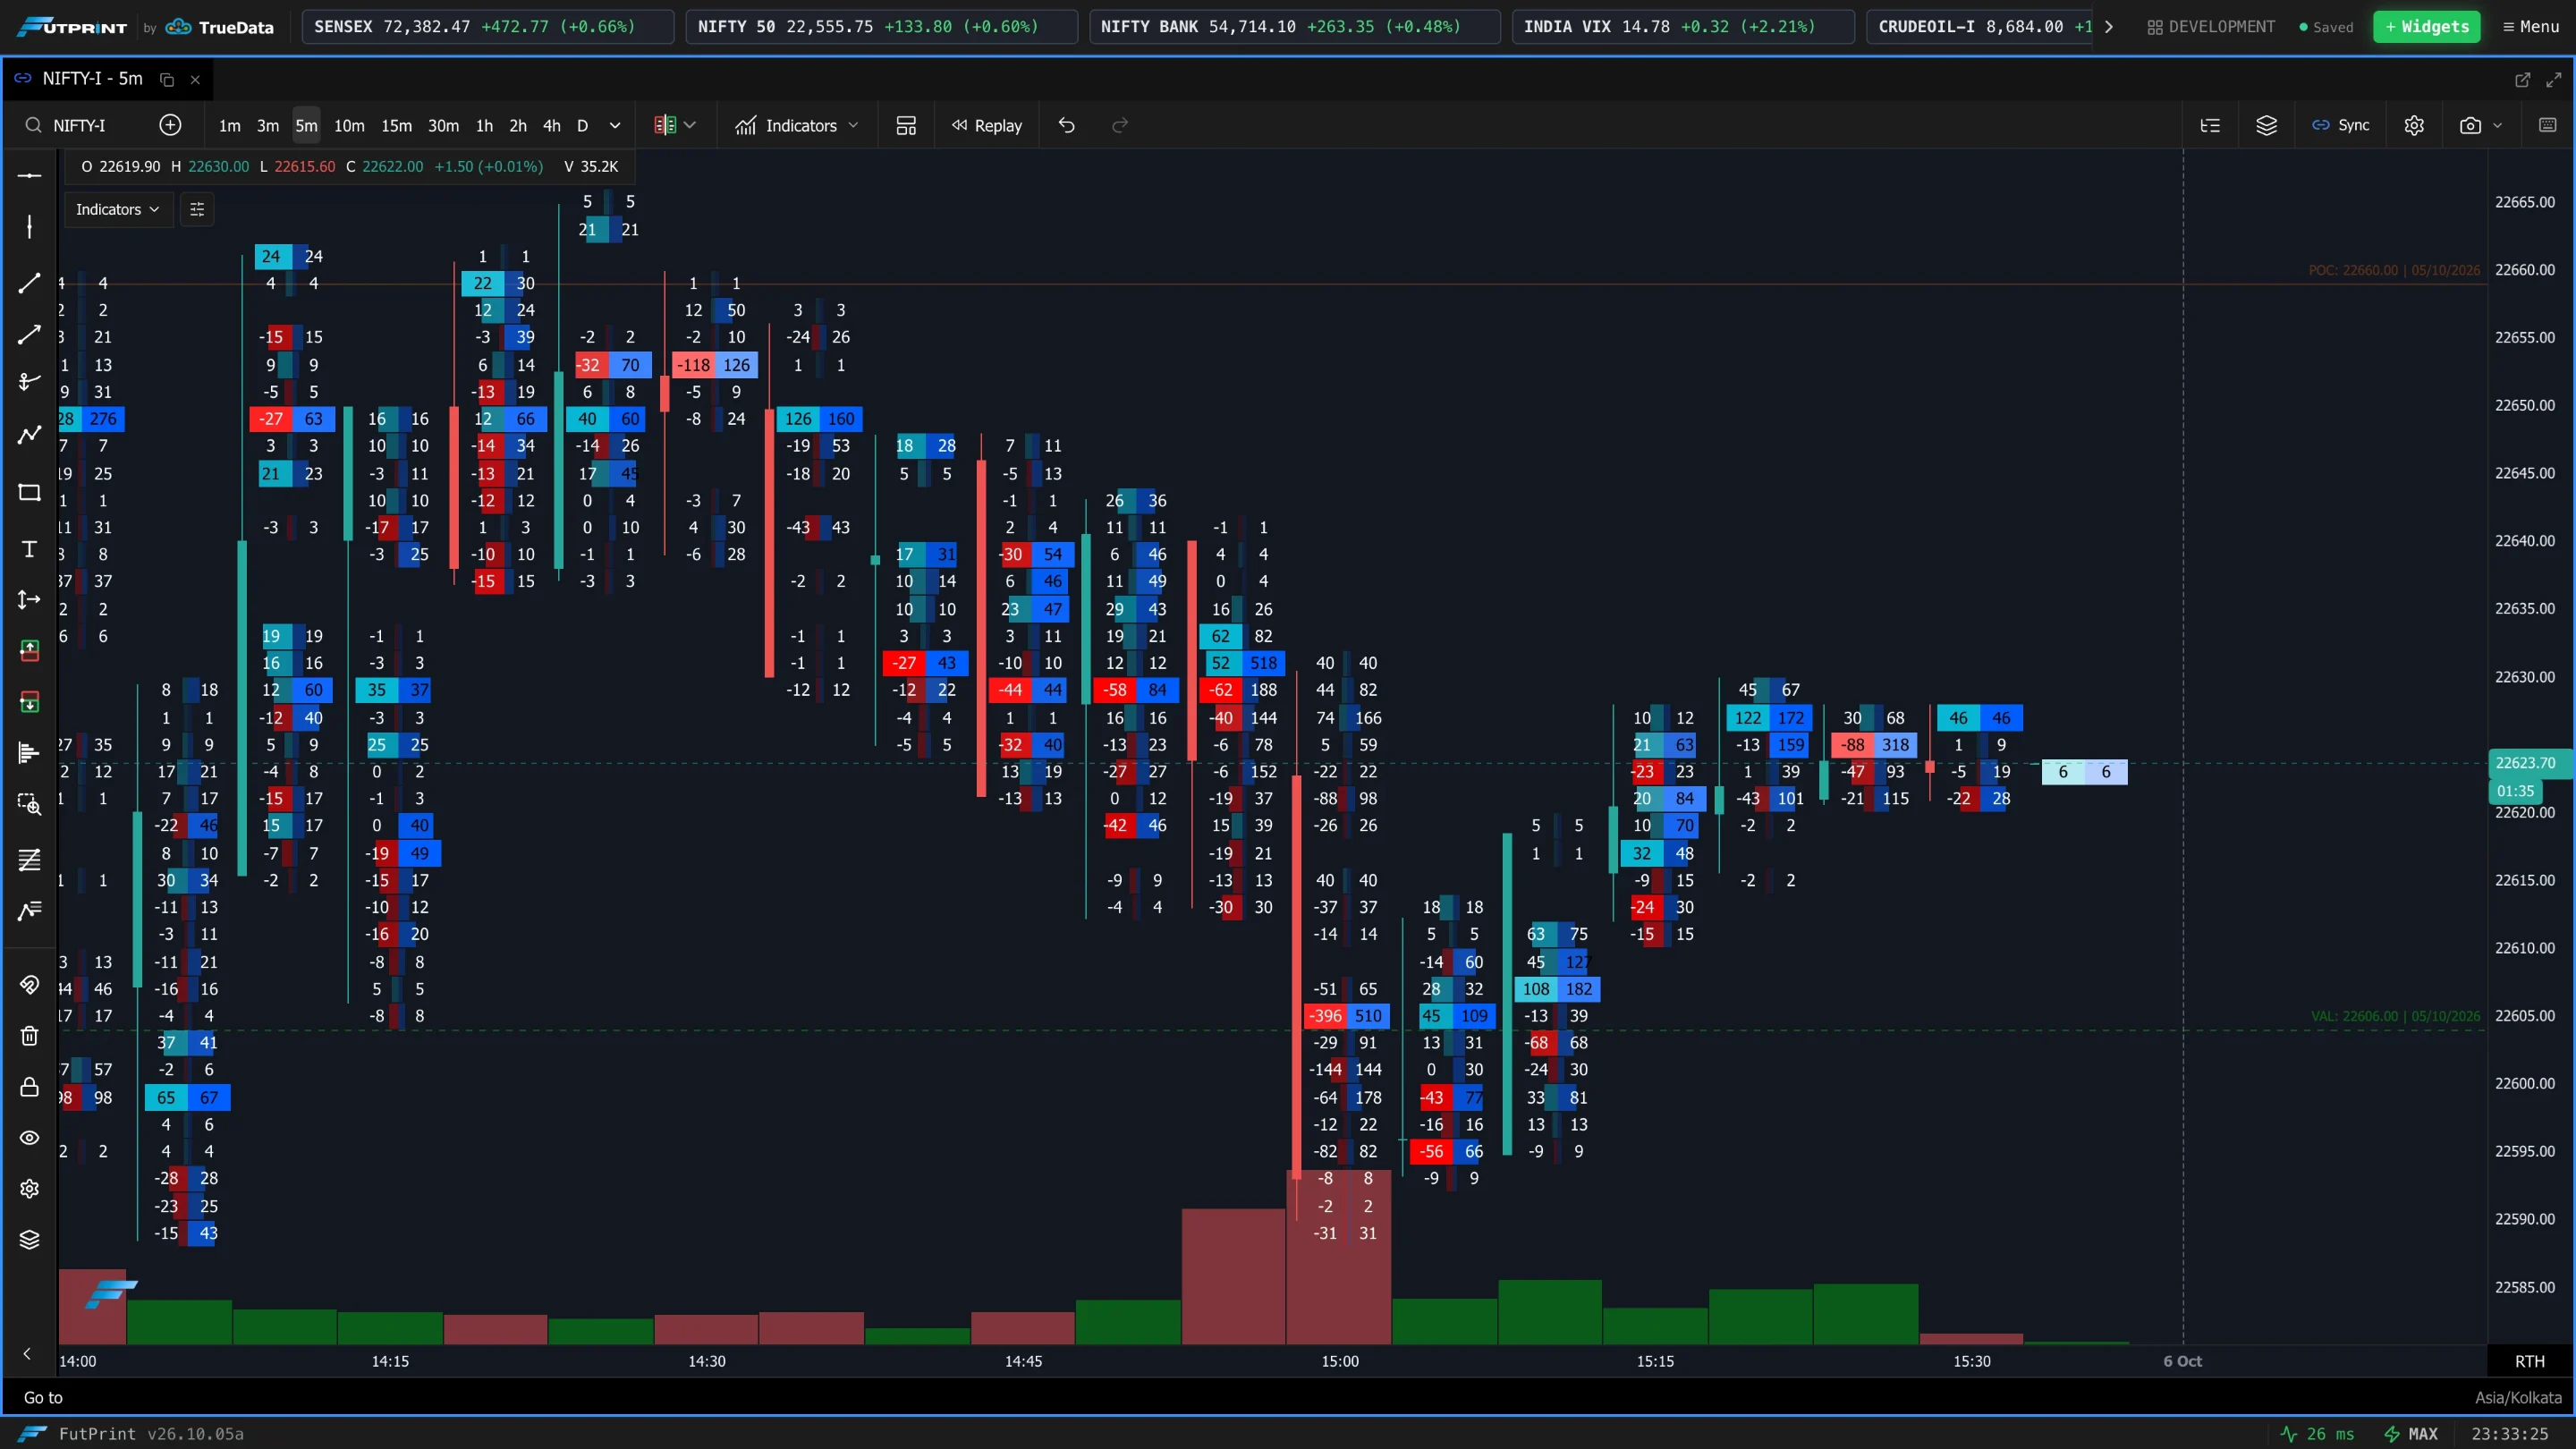
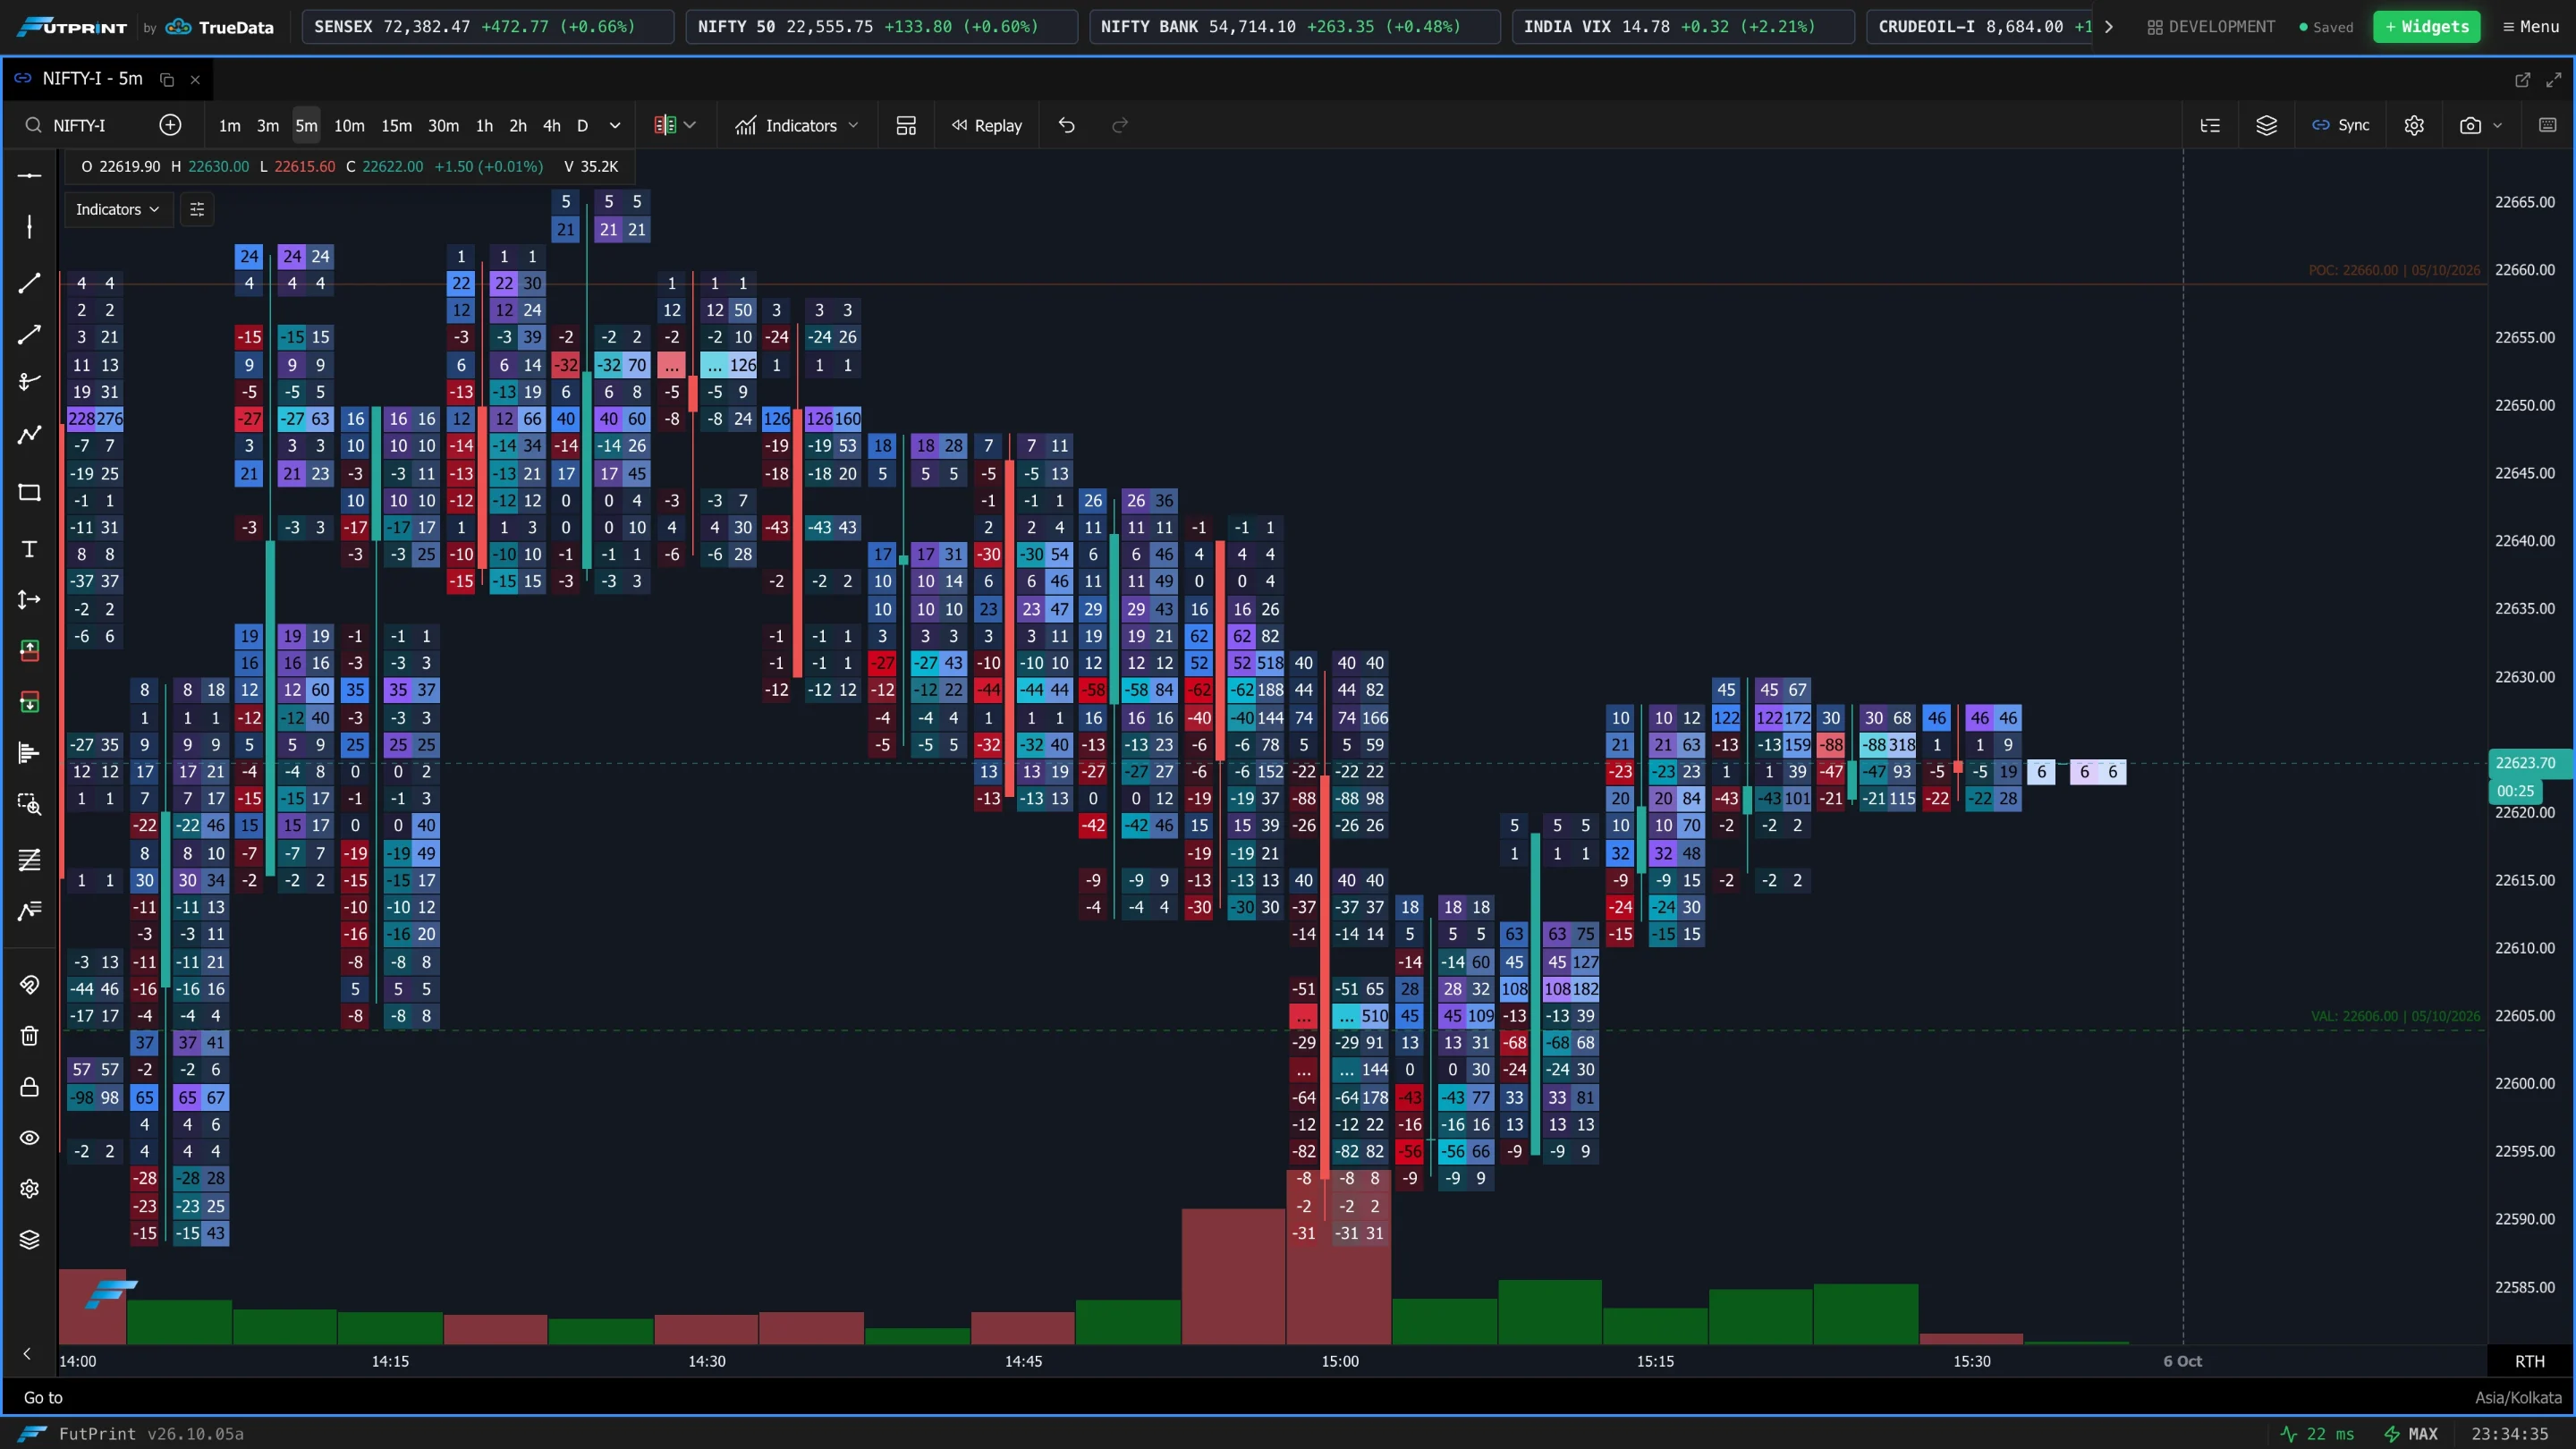
How many columns each candle shows:
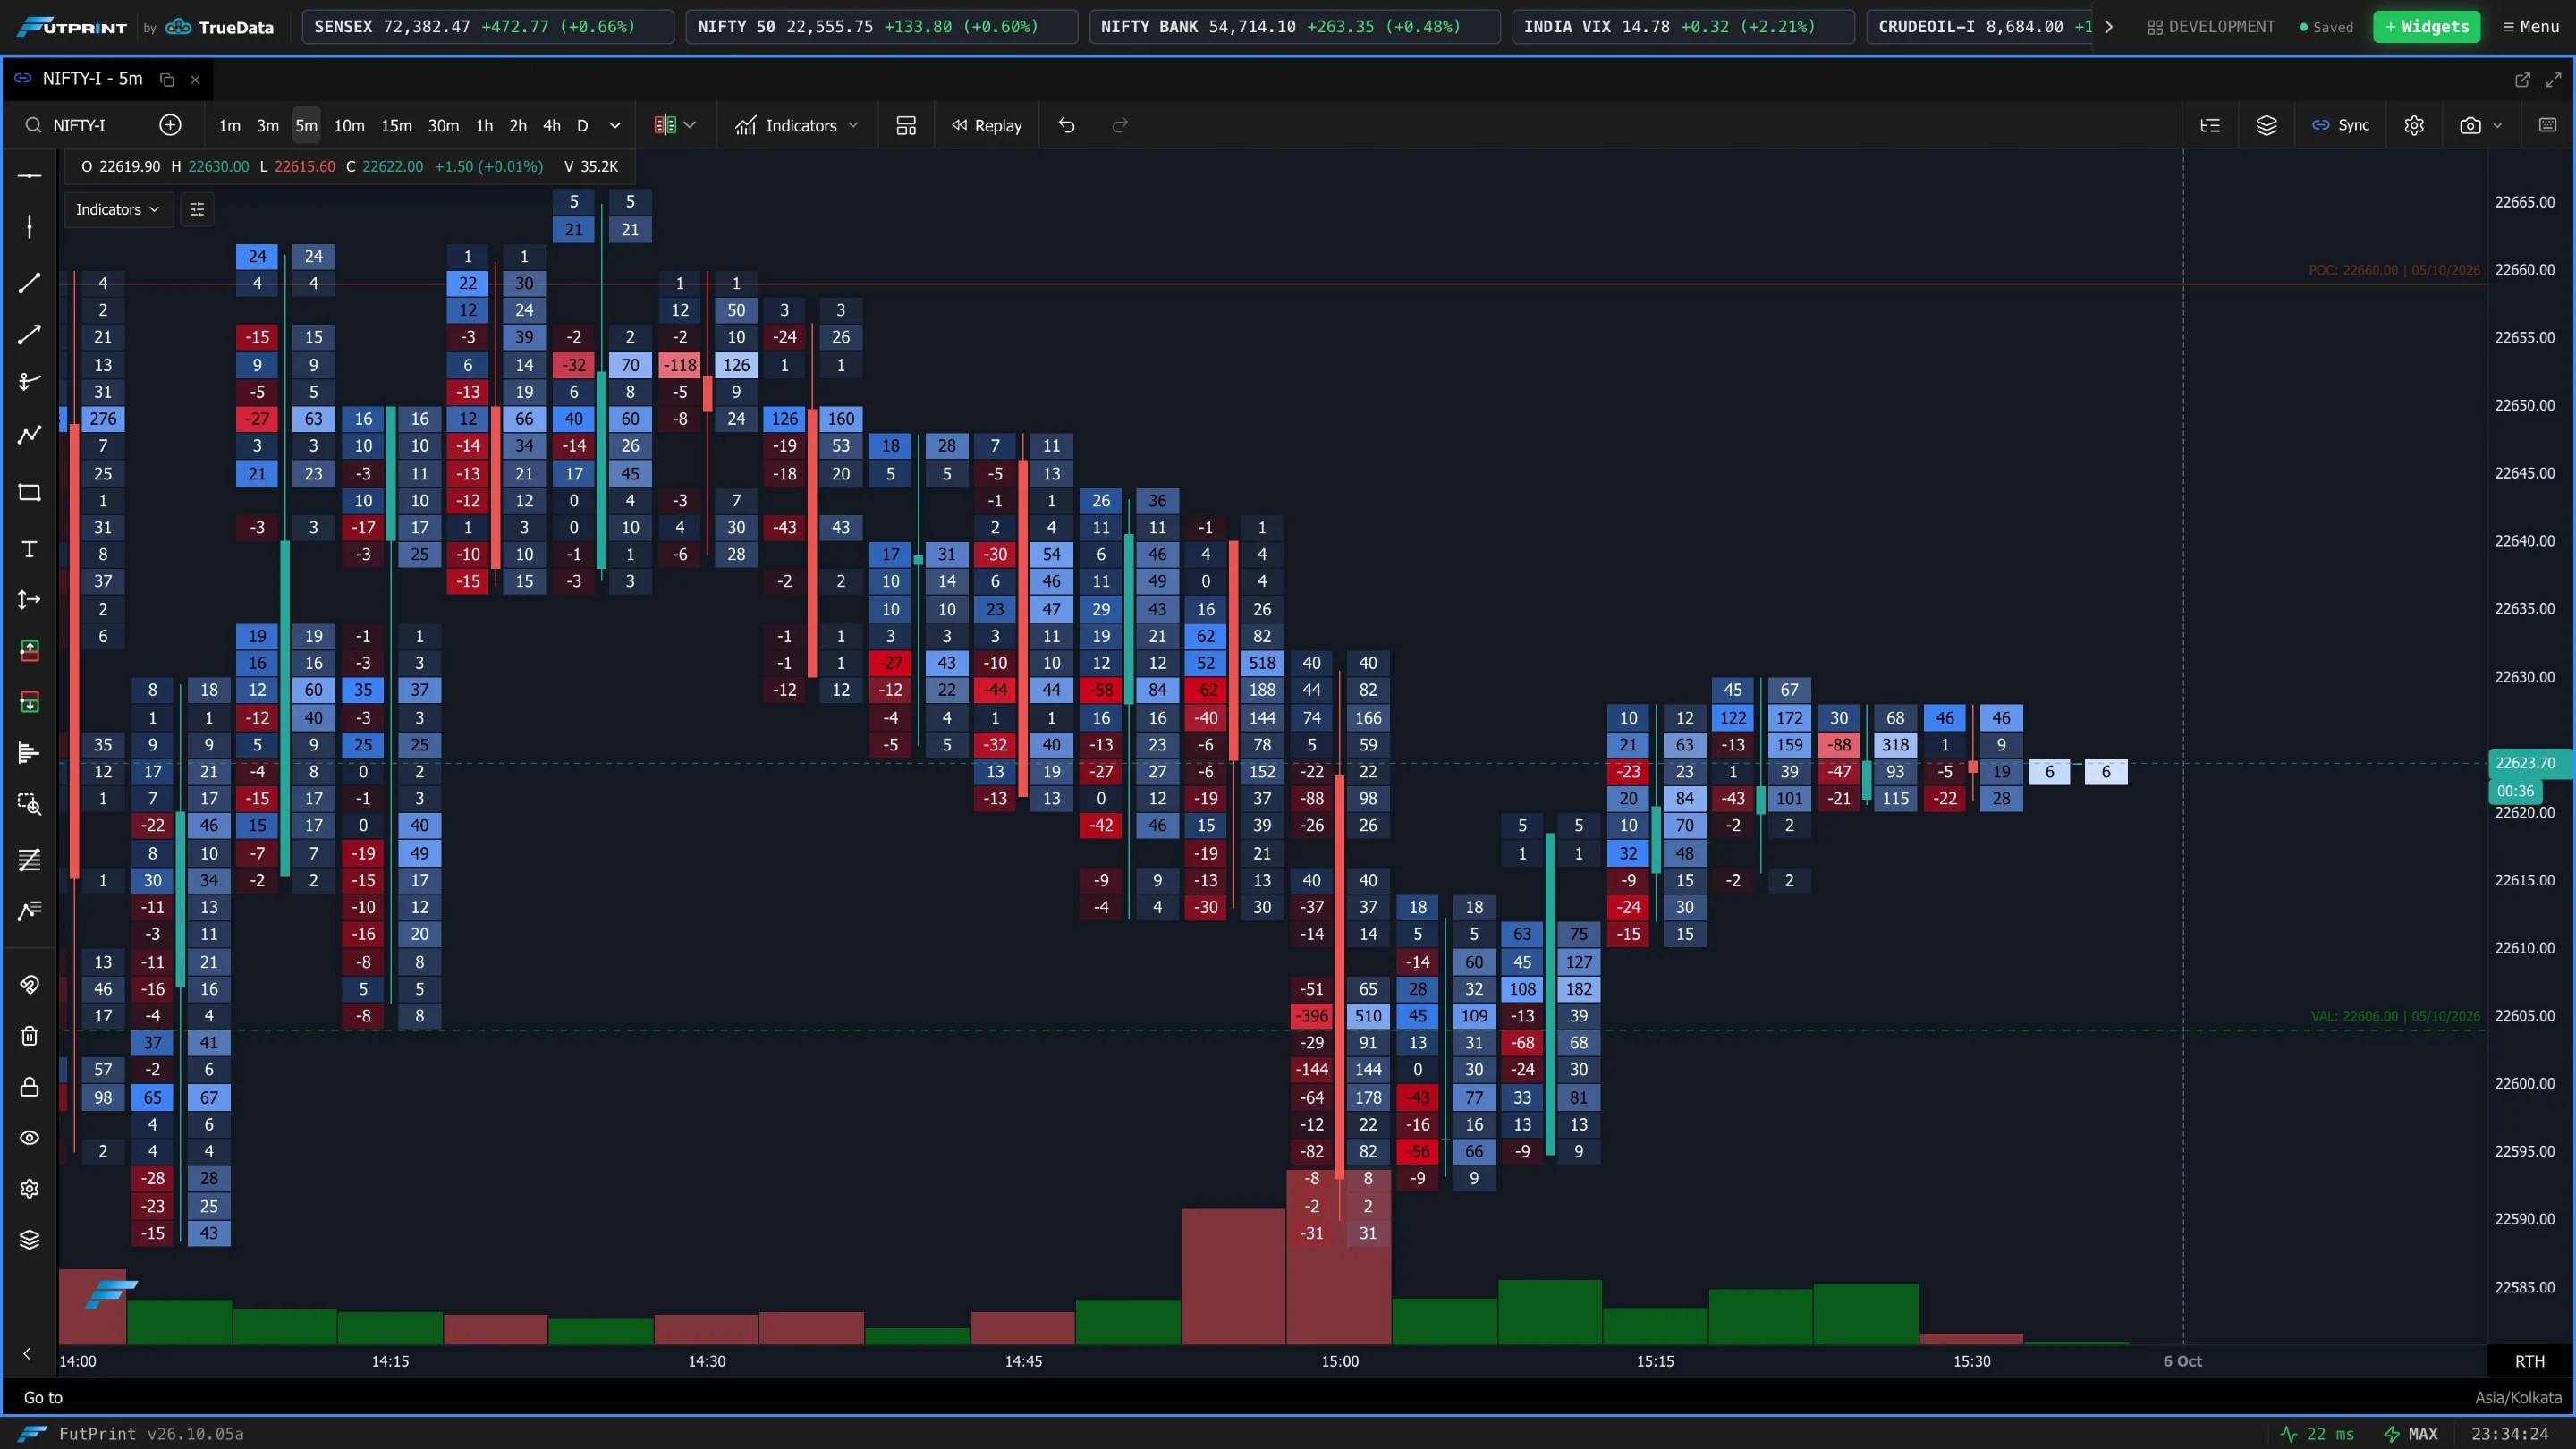
- Double-sided — buy and sell on opposite sides of the price level (the classic bid×ask footprint, full detail).
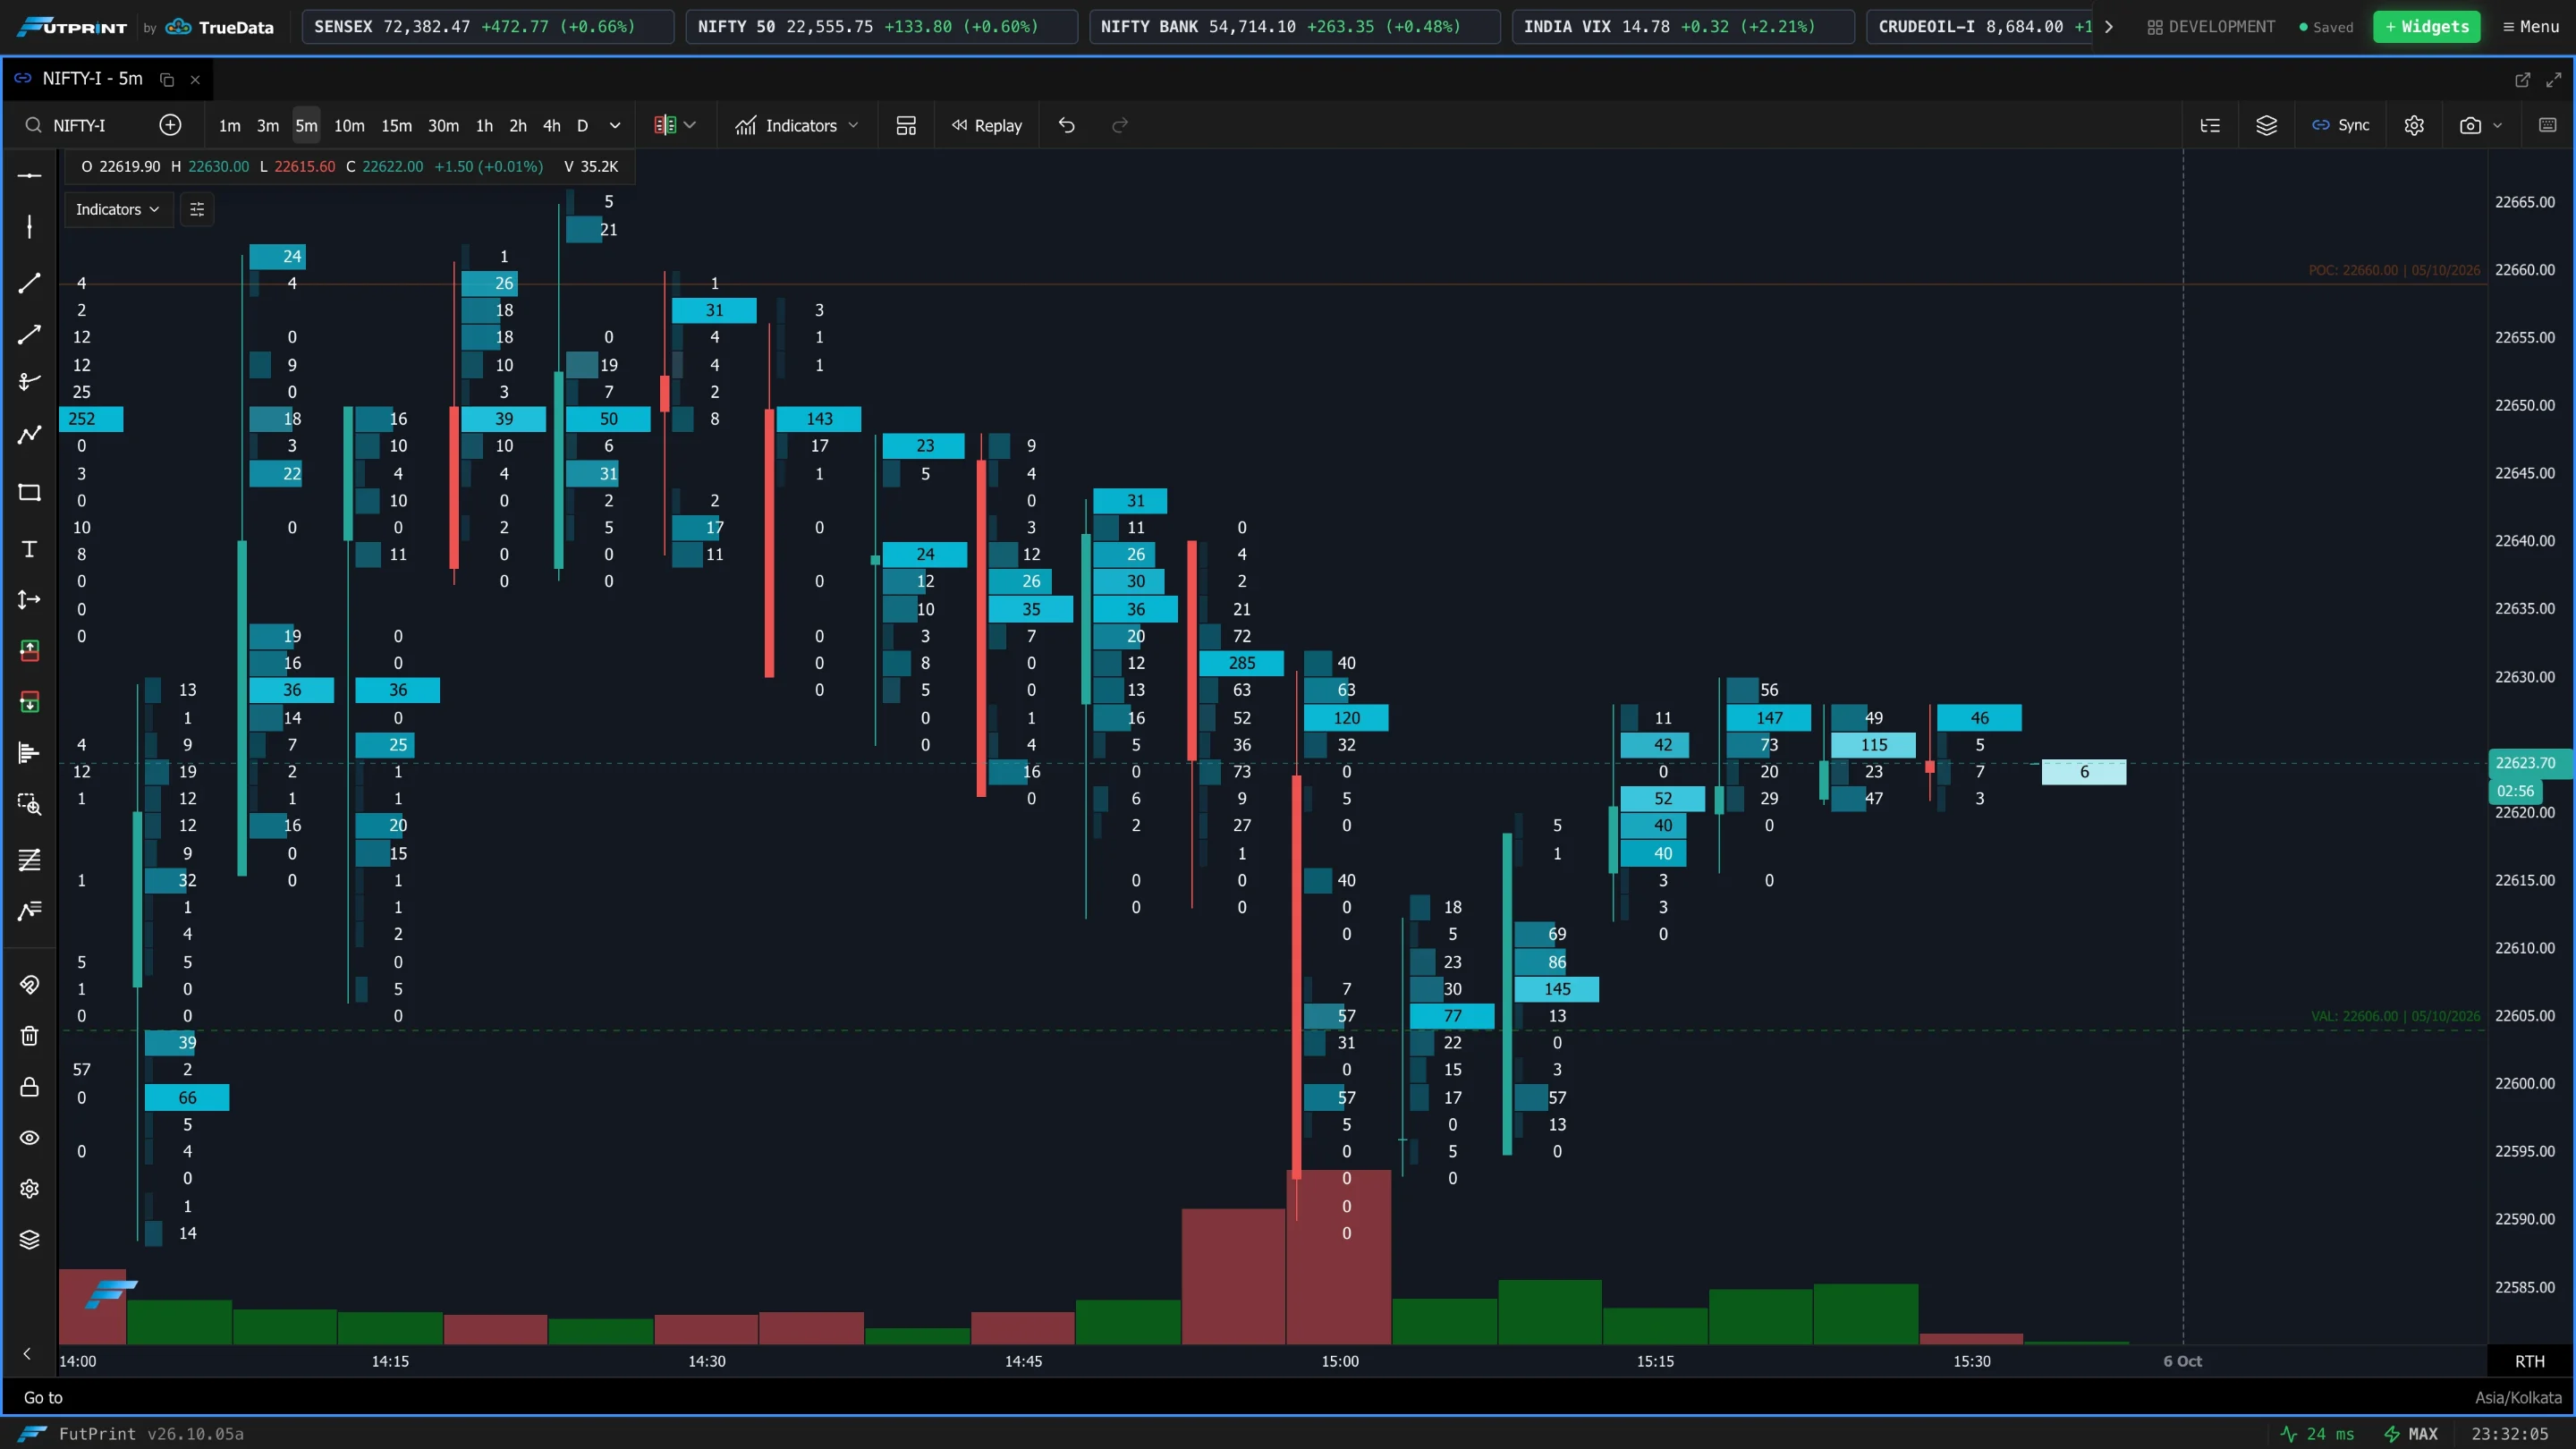
- Single-sided — a single column showing one chosen metric (cleaner; see Volume Type).
- Triple-sided — three columns (left / middle / right), each with its own data type, for advanced multi-metric reads.
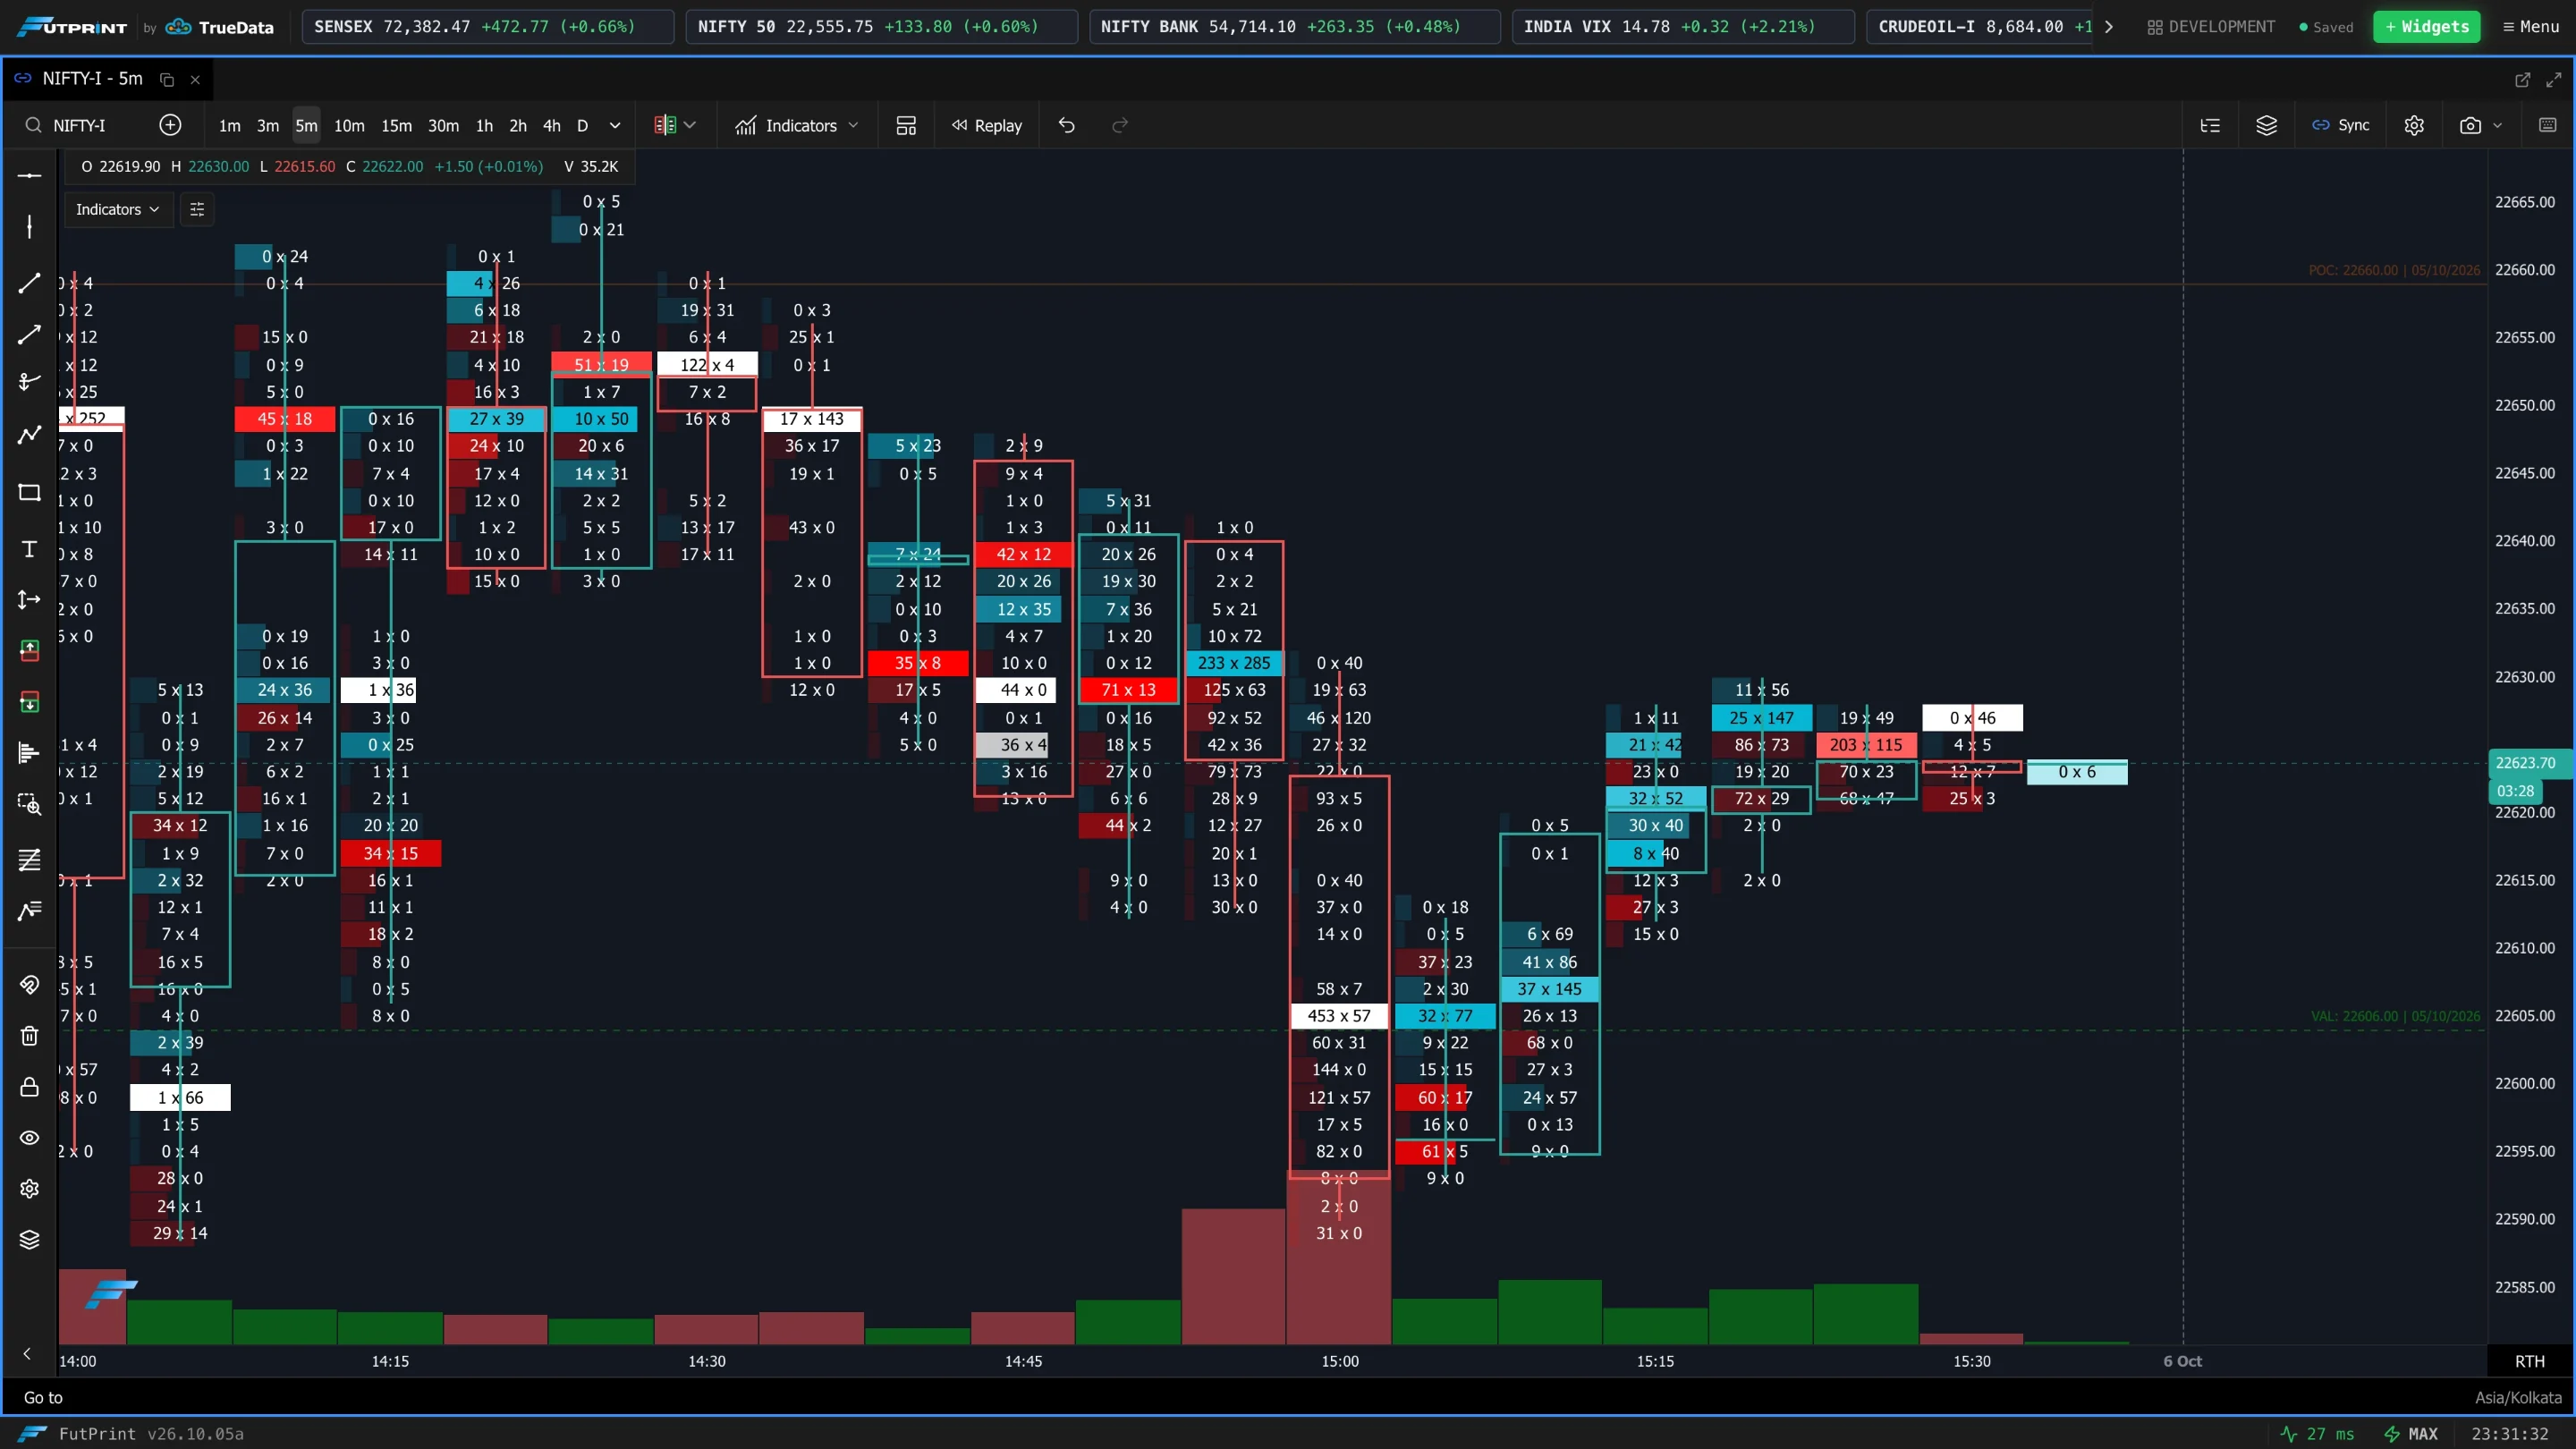
Show Candlestick
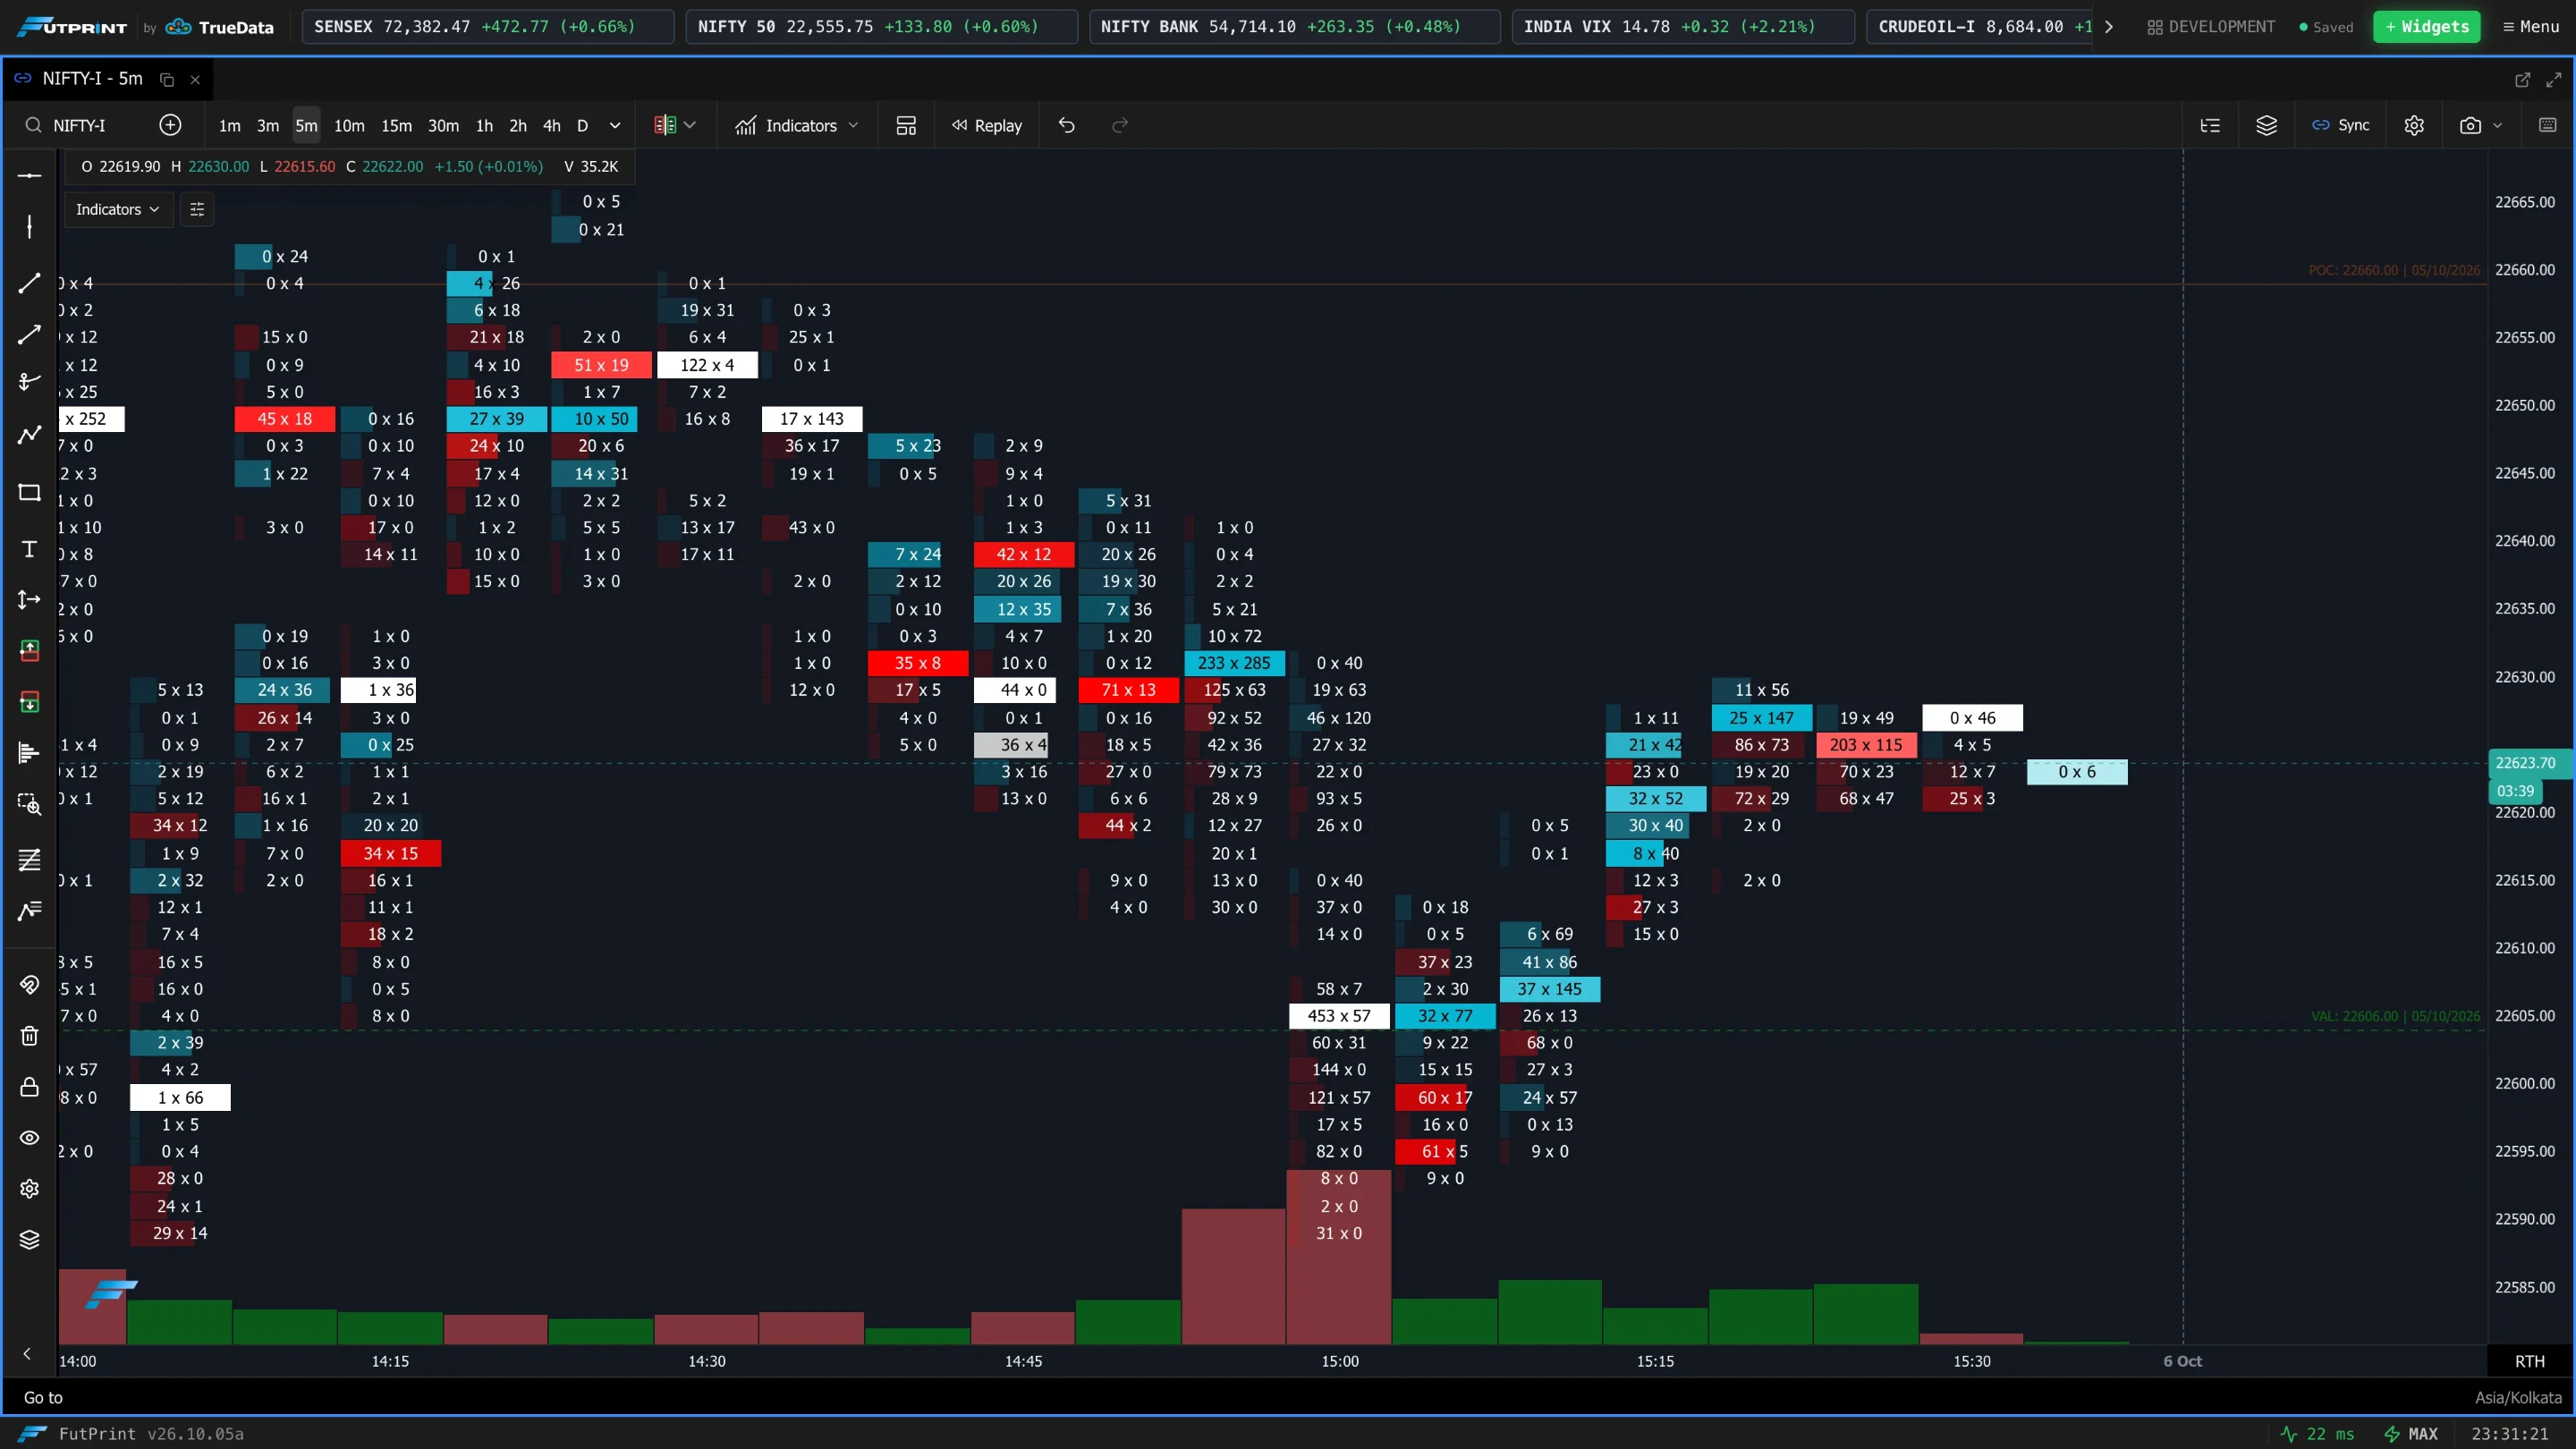
Show or hide the candlestick overlay drawn on top of the footprint.
Candle Style
(shown when the candlestick is on)
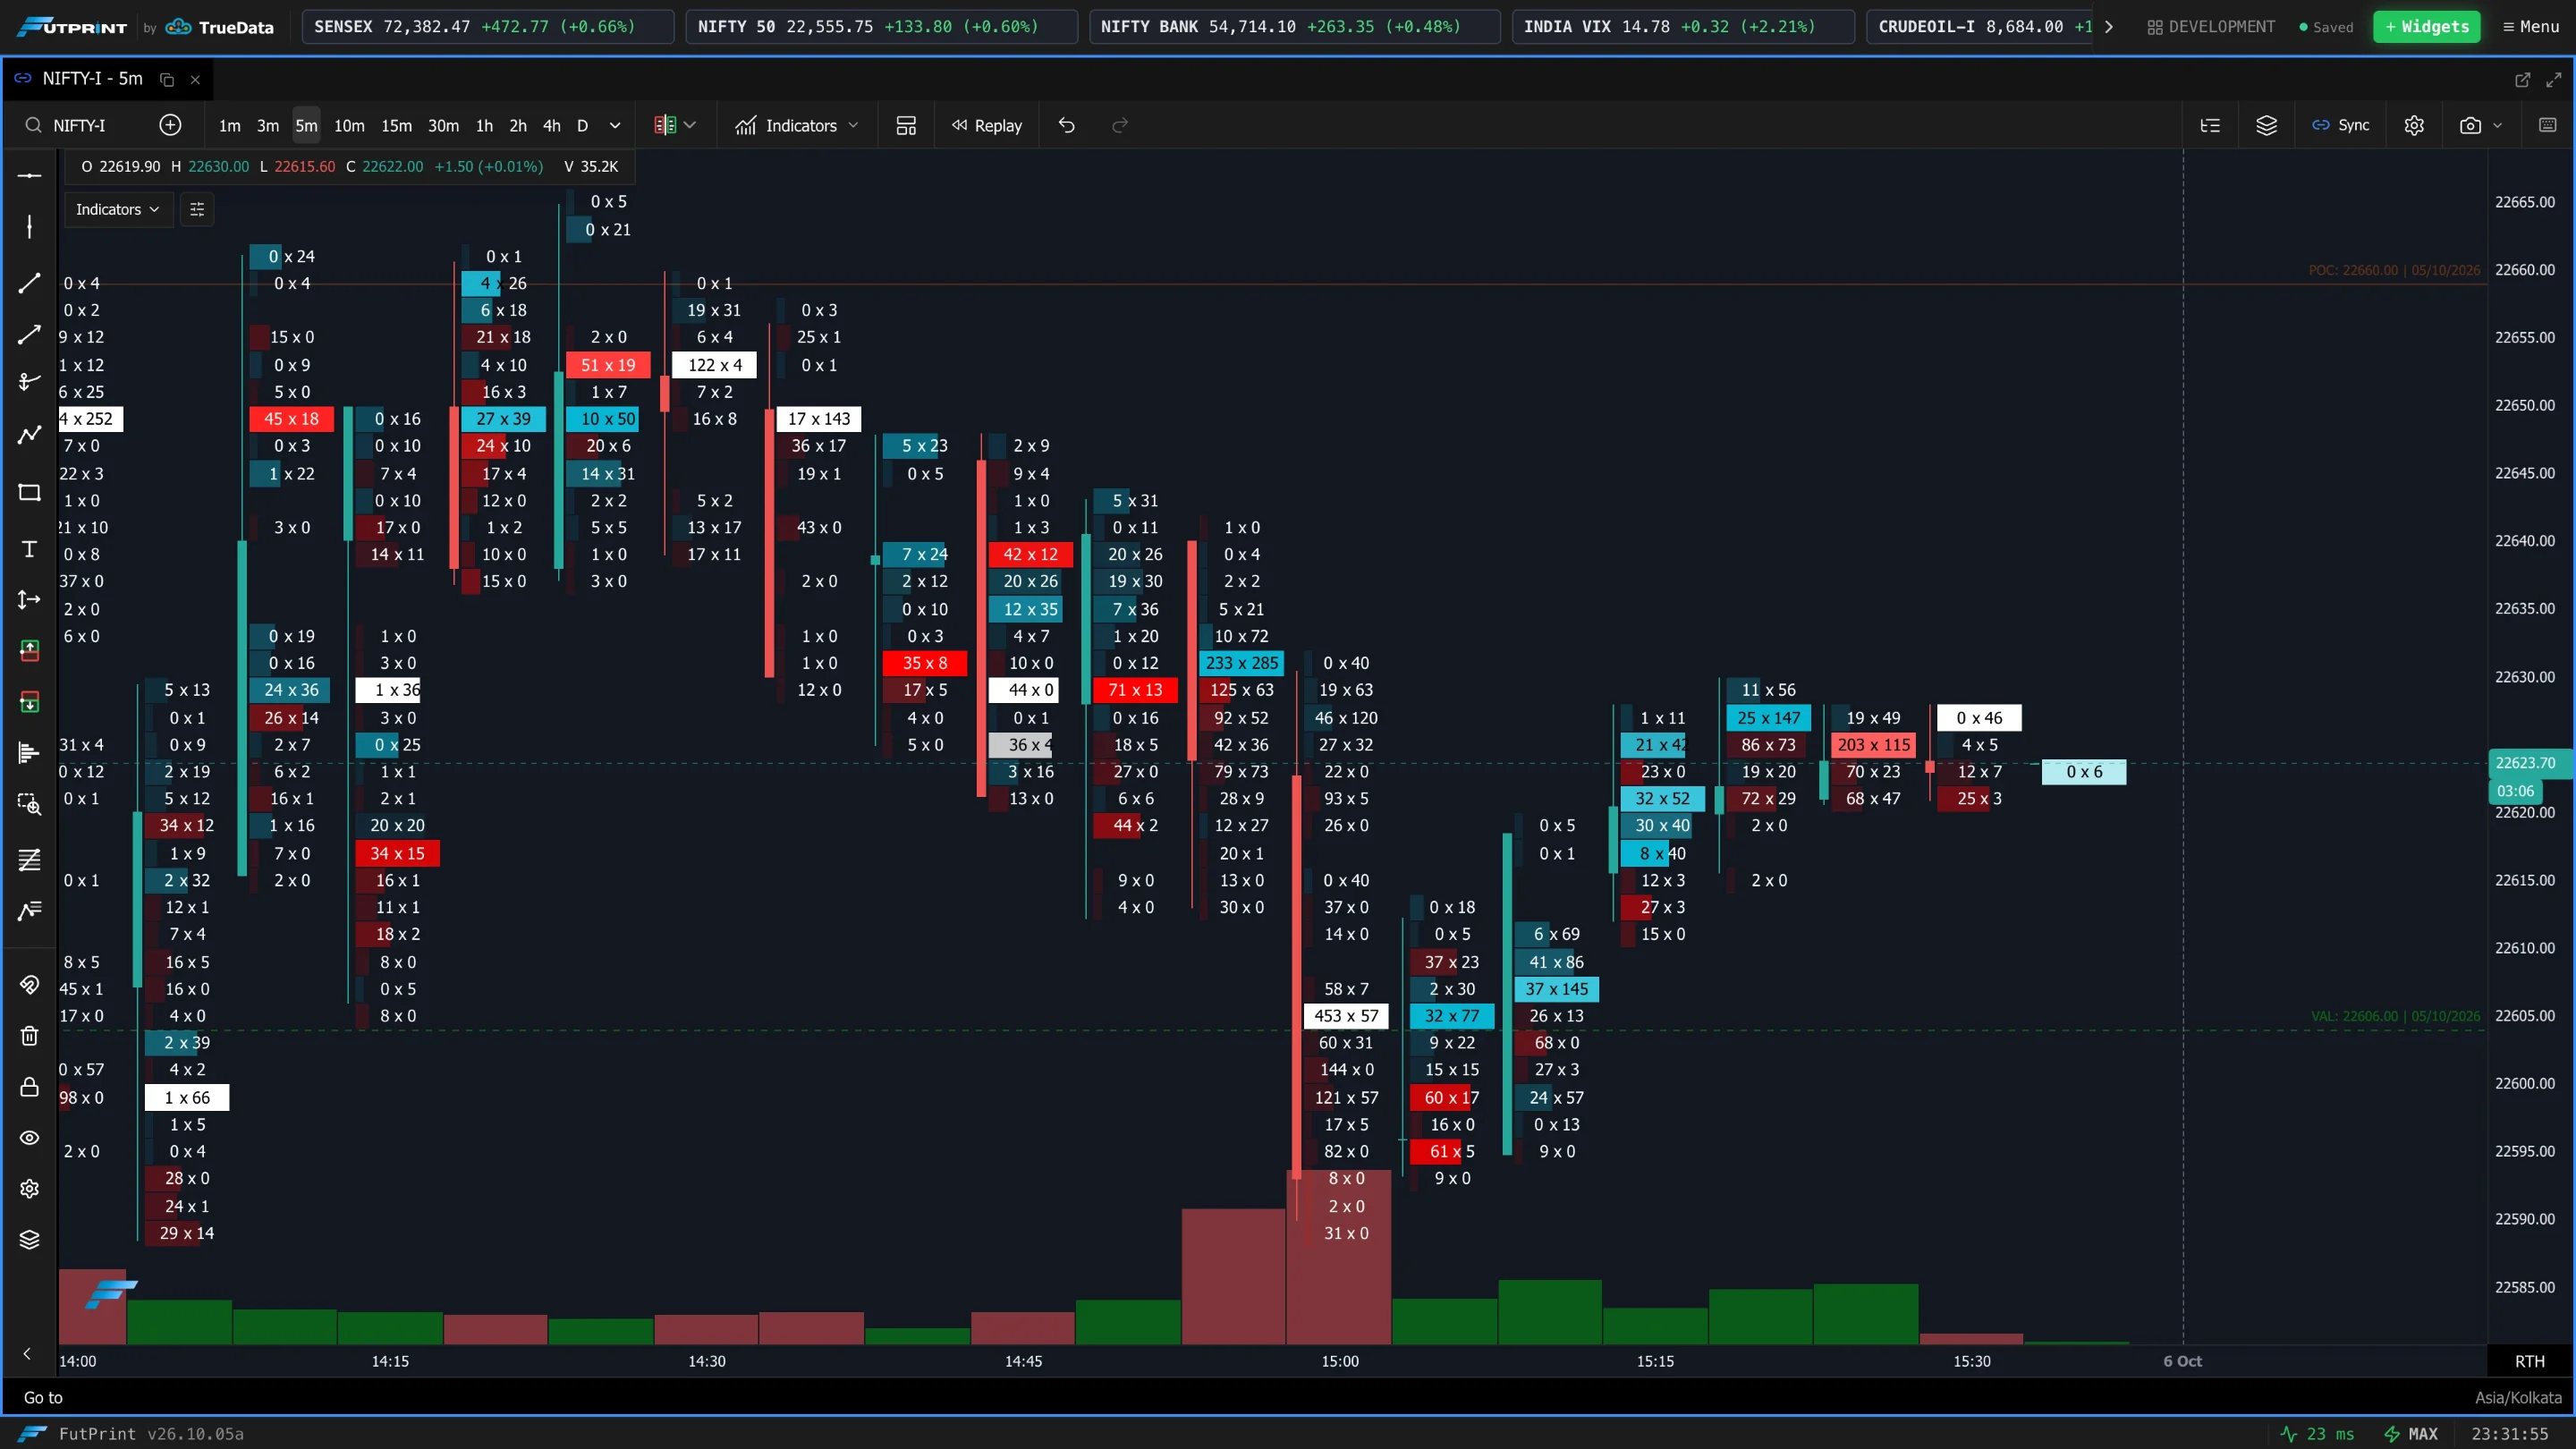
- Slim — narrow candle (≈60% width) that leaves room for footprint data beside it.
- Thick — full-width candle drawn as an outline over the footprint; when thick is used the footprint occupies the whole width and Candle Position no longer applies.
Candle Position
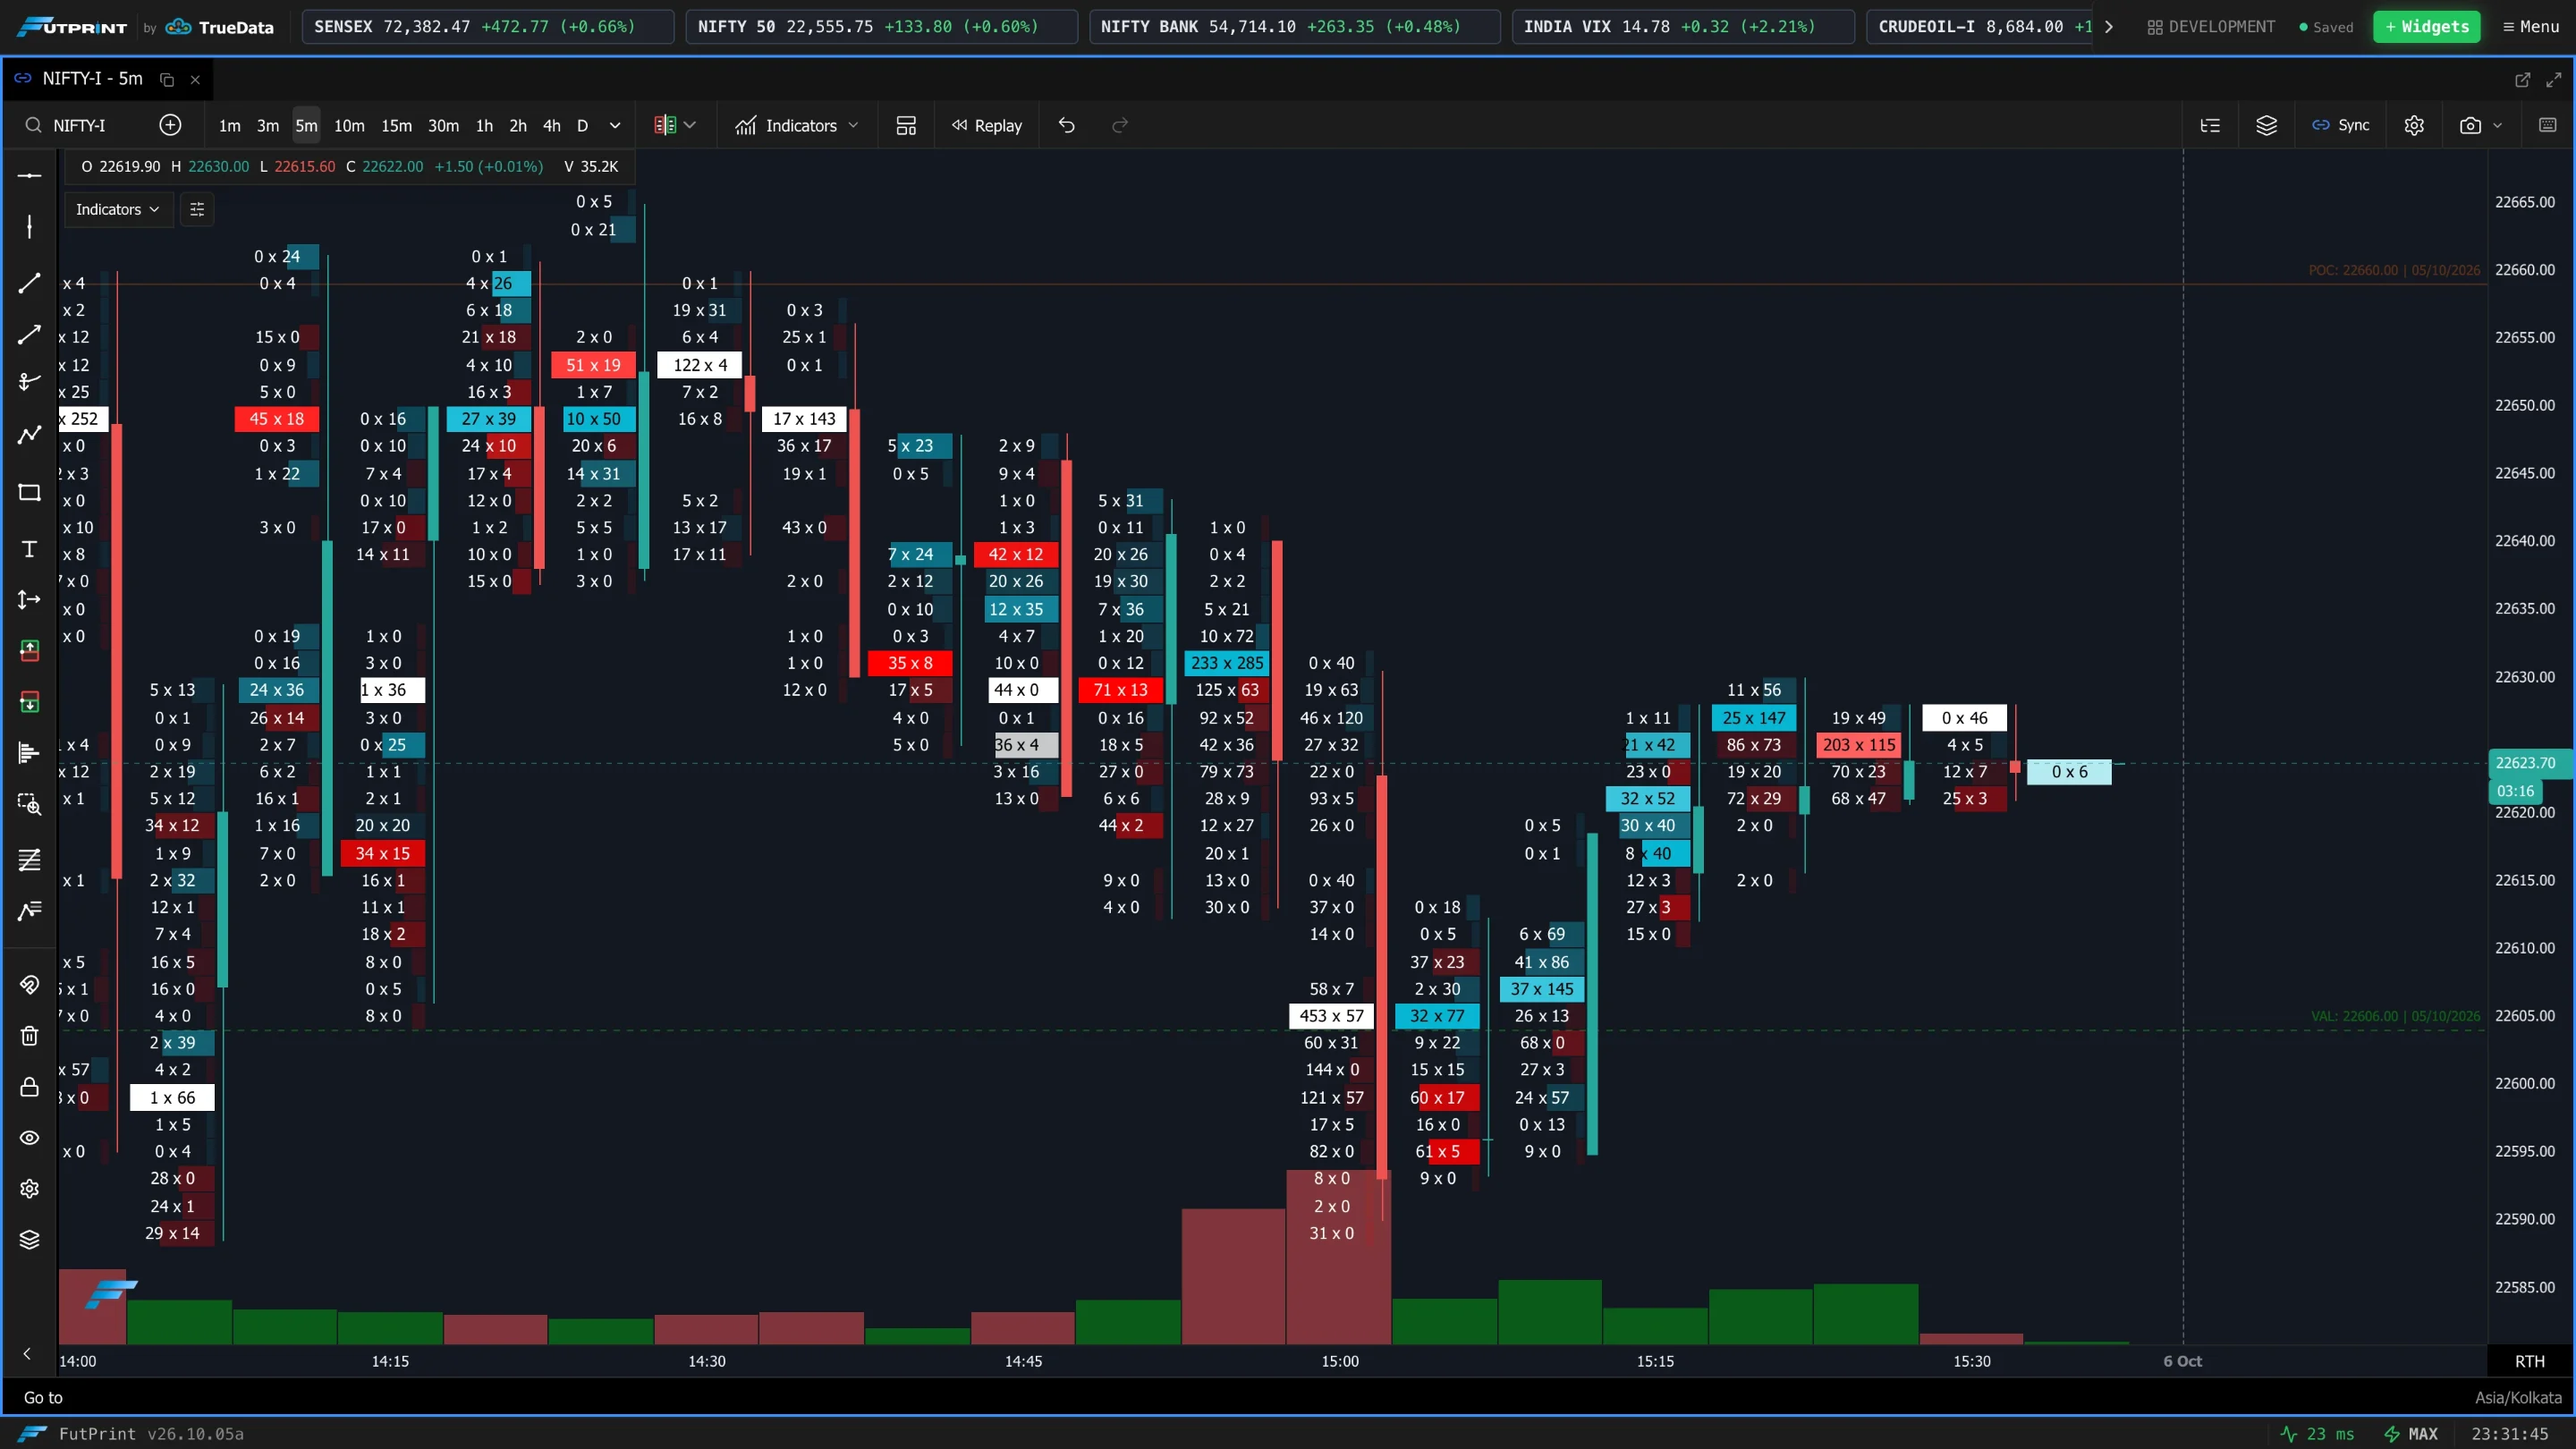
(shown for slim candles) Where the candle sits relative to the footprint columns. Options depend on the cluster style:
- Triple-sided: Left (Start), Left Center (between columns 1–2), Right Center (between columns 2–3), Right (End).
- Double-sided: Left, Center, Right.
- Single-sided: Left, Right (center isn't available).
Volume Type / Side Data Type
What each column actually shows. For single-sided this is Volume Type; for double/triple-sided there's a Left, Right (and Middle) Side Data Type. All offer the same choices:
| Data type | Meaning |
|---|---|
| Buy Volume | Aggressive buying volume at the level. |
| Sell Volume | Aggressive selling volume at the level. |
| Delta | Net pressure (buy − sell); the most-used single metric. |
| Total Volume | All volume at the level, regardless of side. |
| Bid-Ask Volume | Volume split as traded at the bid vs the ask. |
| Bid-Ask Delta Volume | The bid-vs-ask difference as a delta. |
| Buy Trades | Count of aggressive buy trades (not volume). |
| Sell Trades | Count of aggressive sell trades. |
| Delta % | Delta expressed as a percentage of the level's volume. |
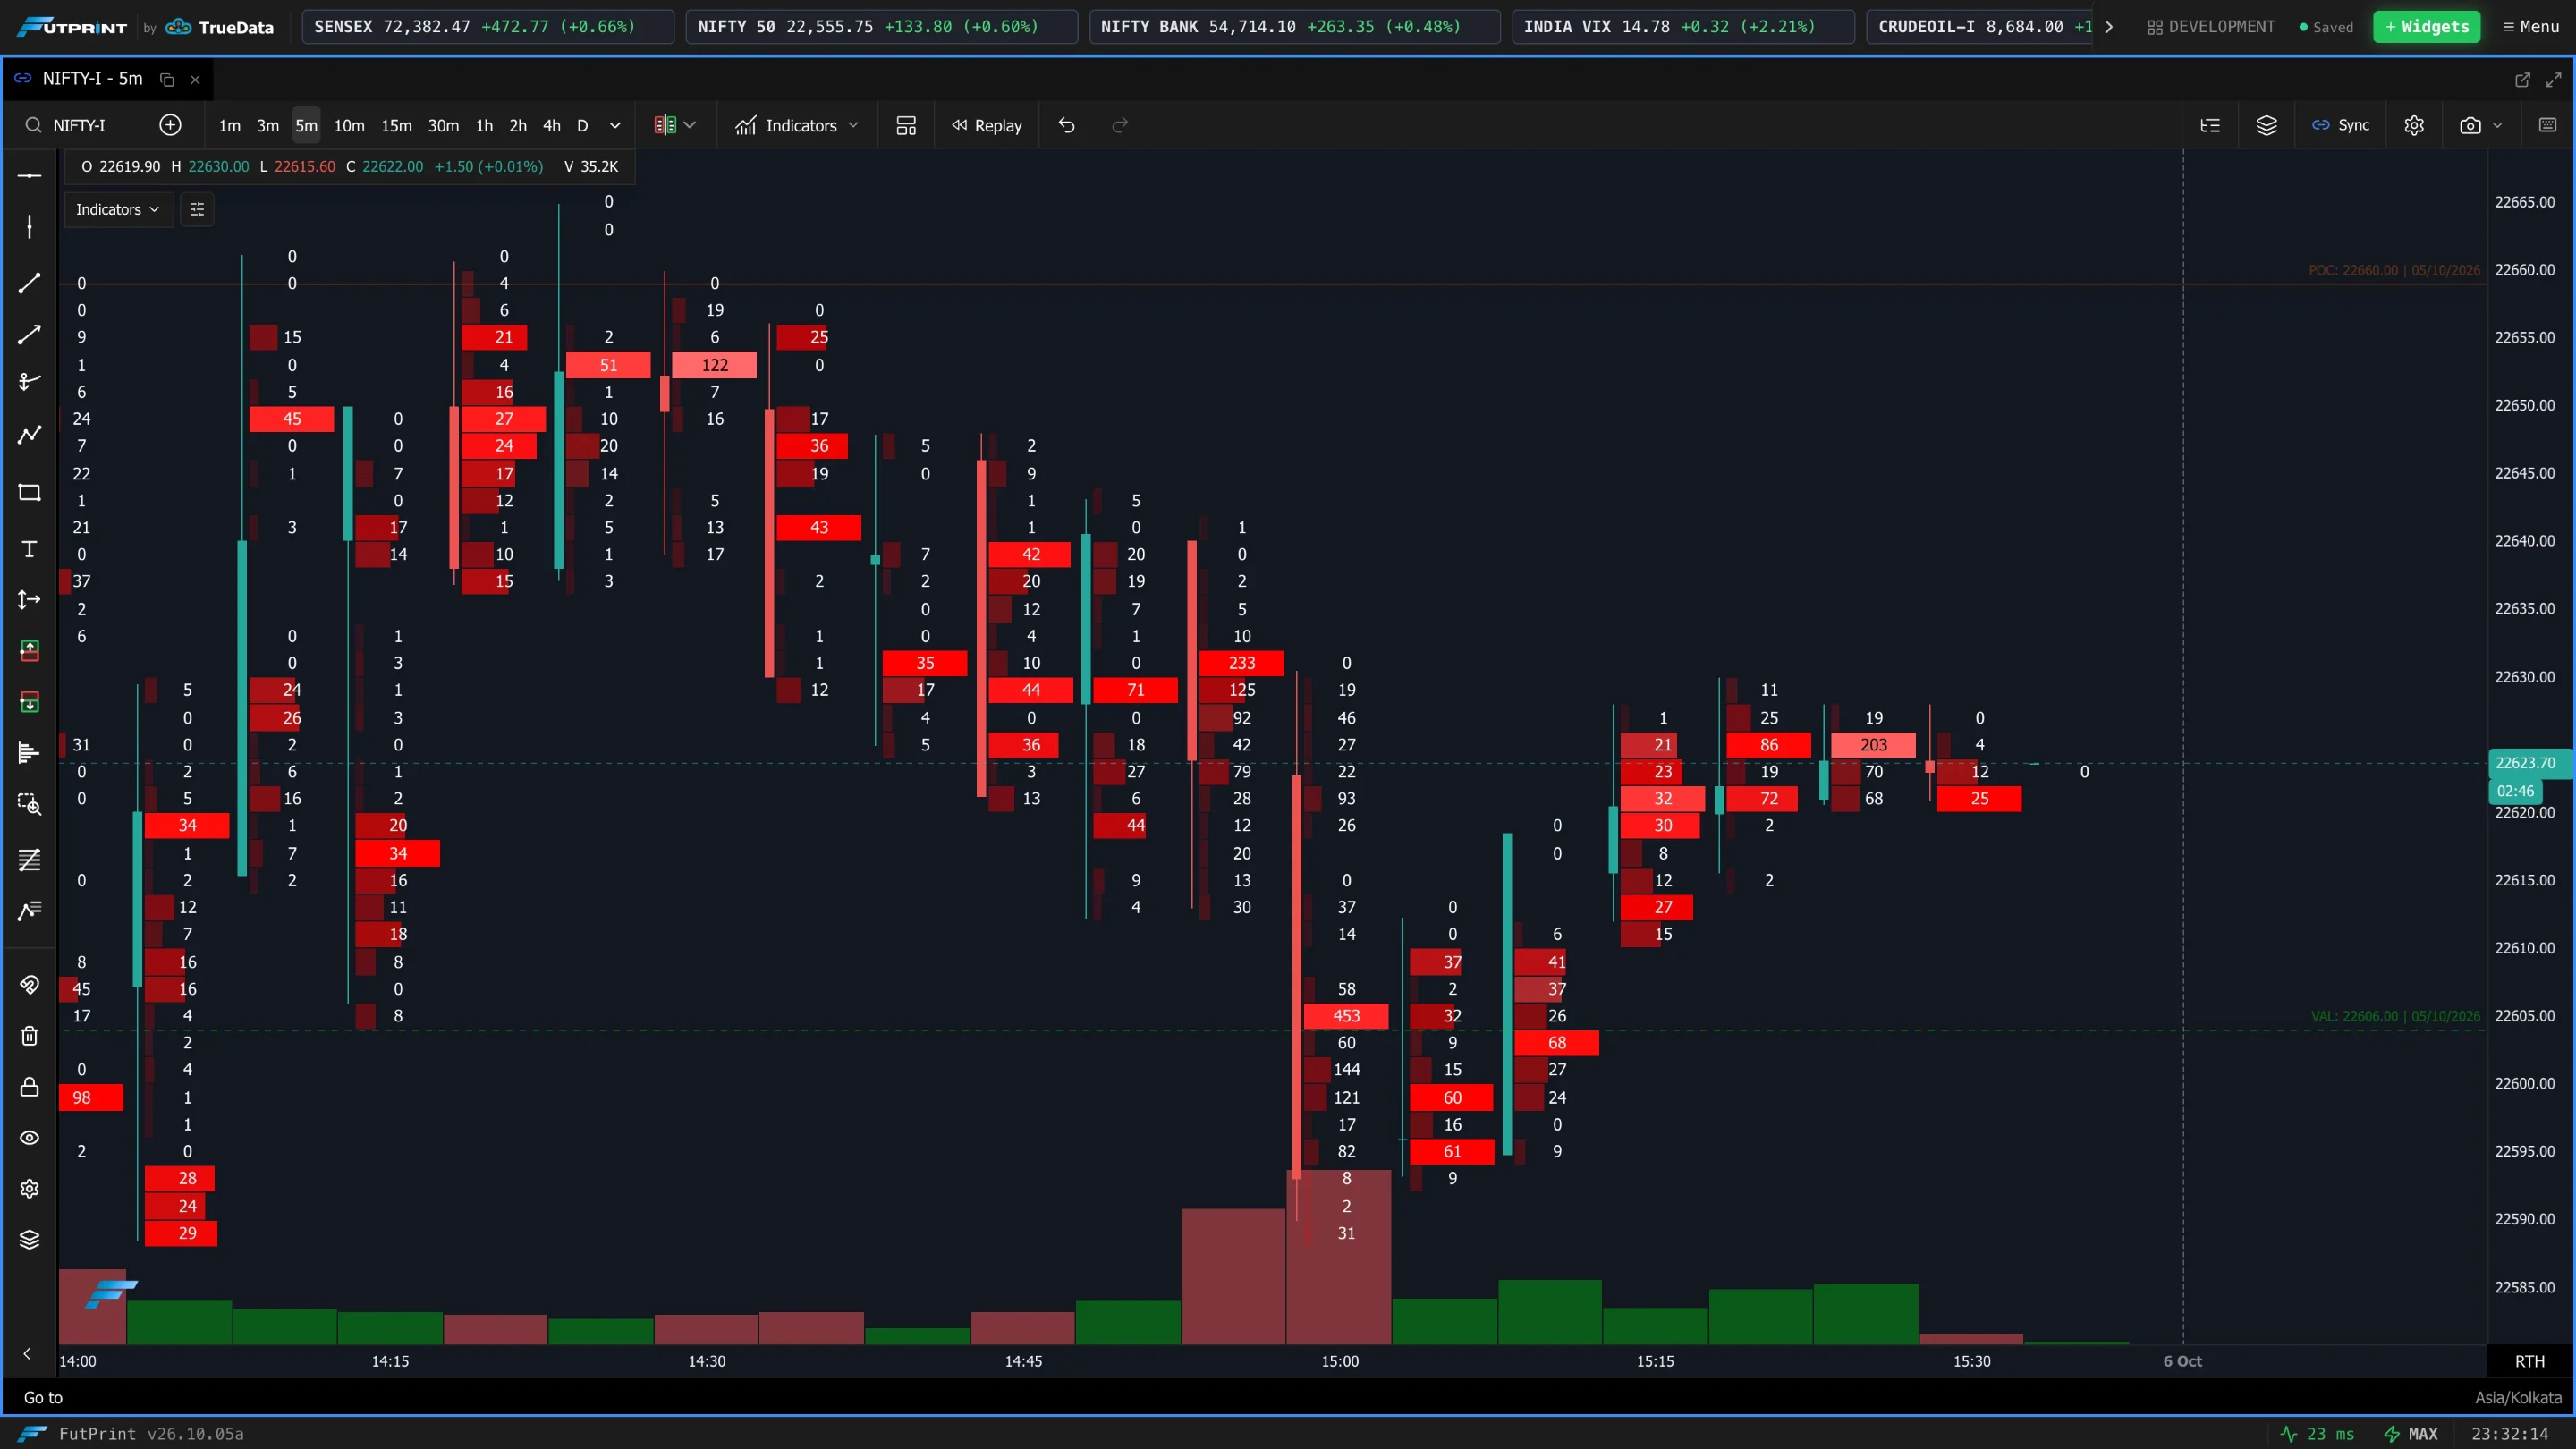
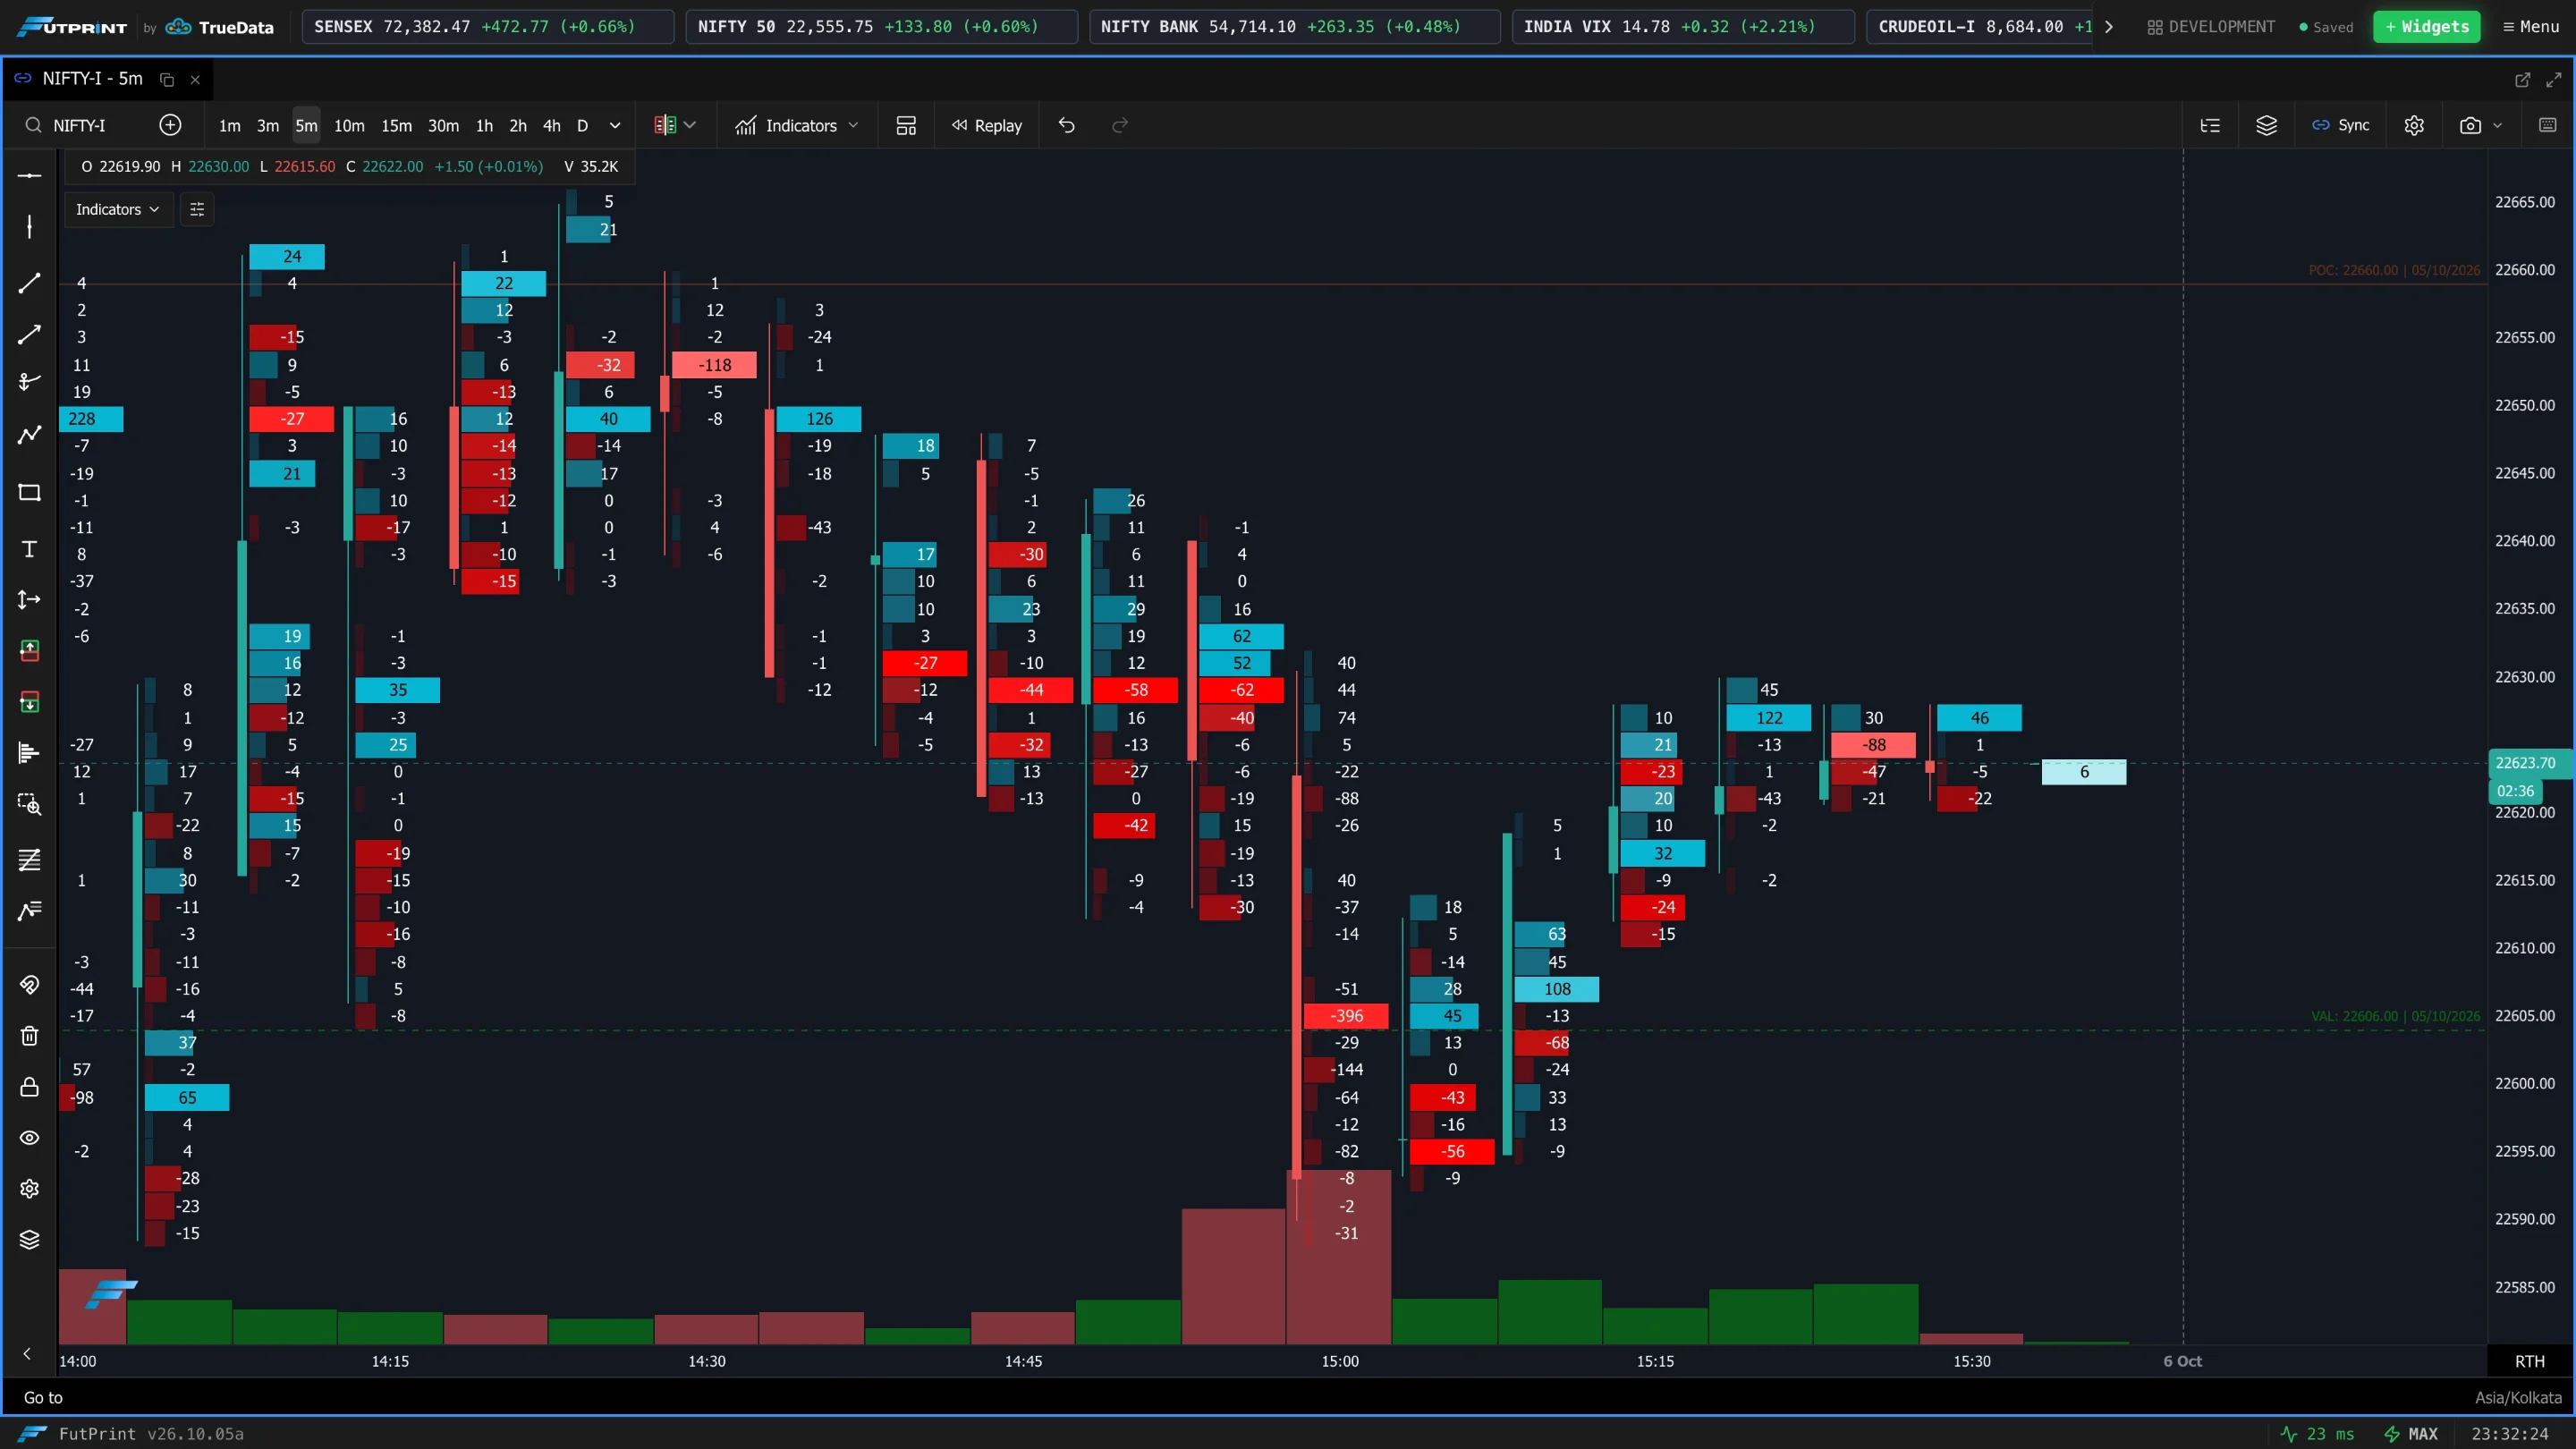
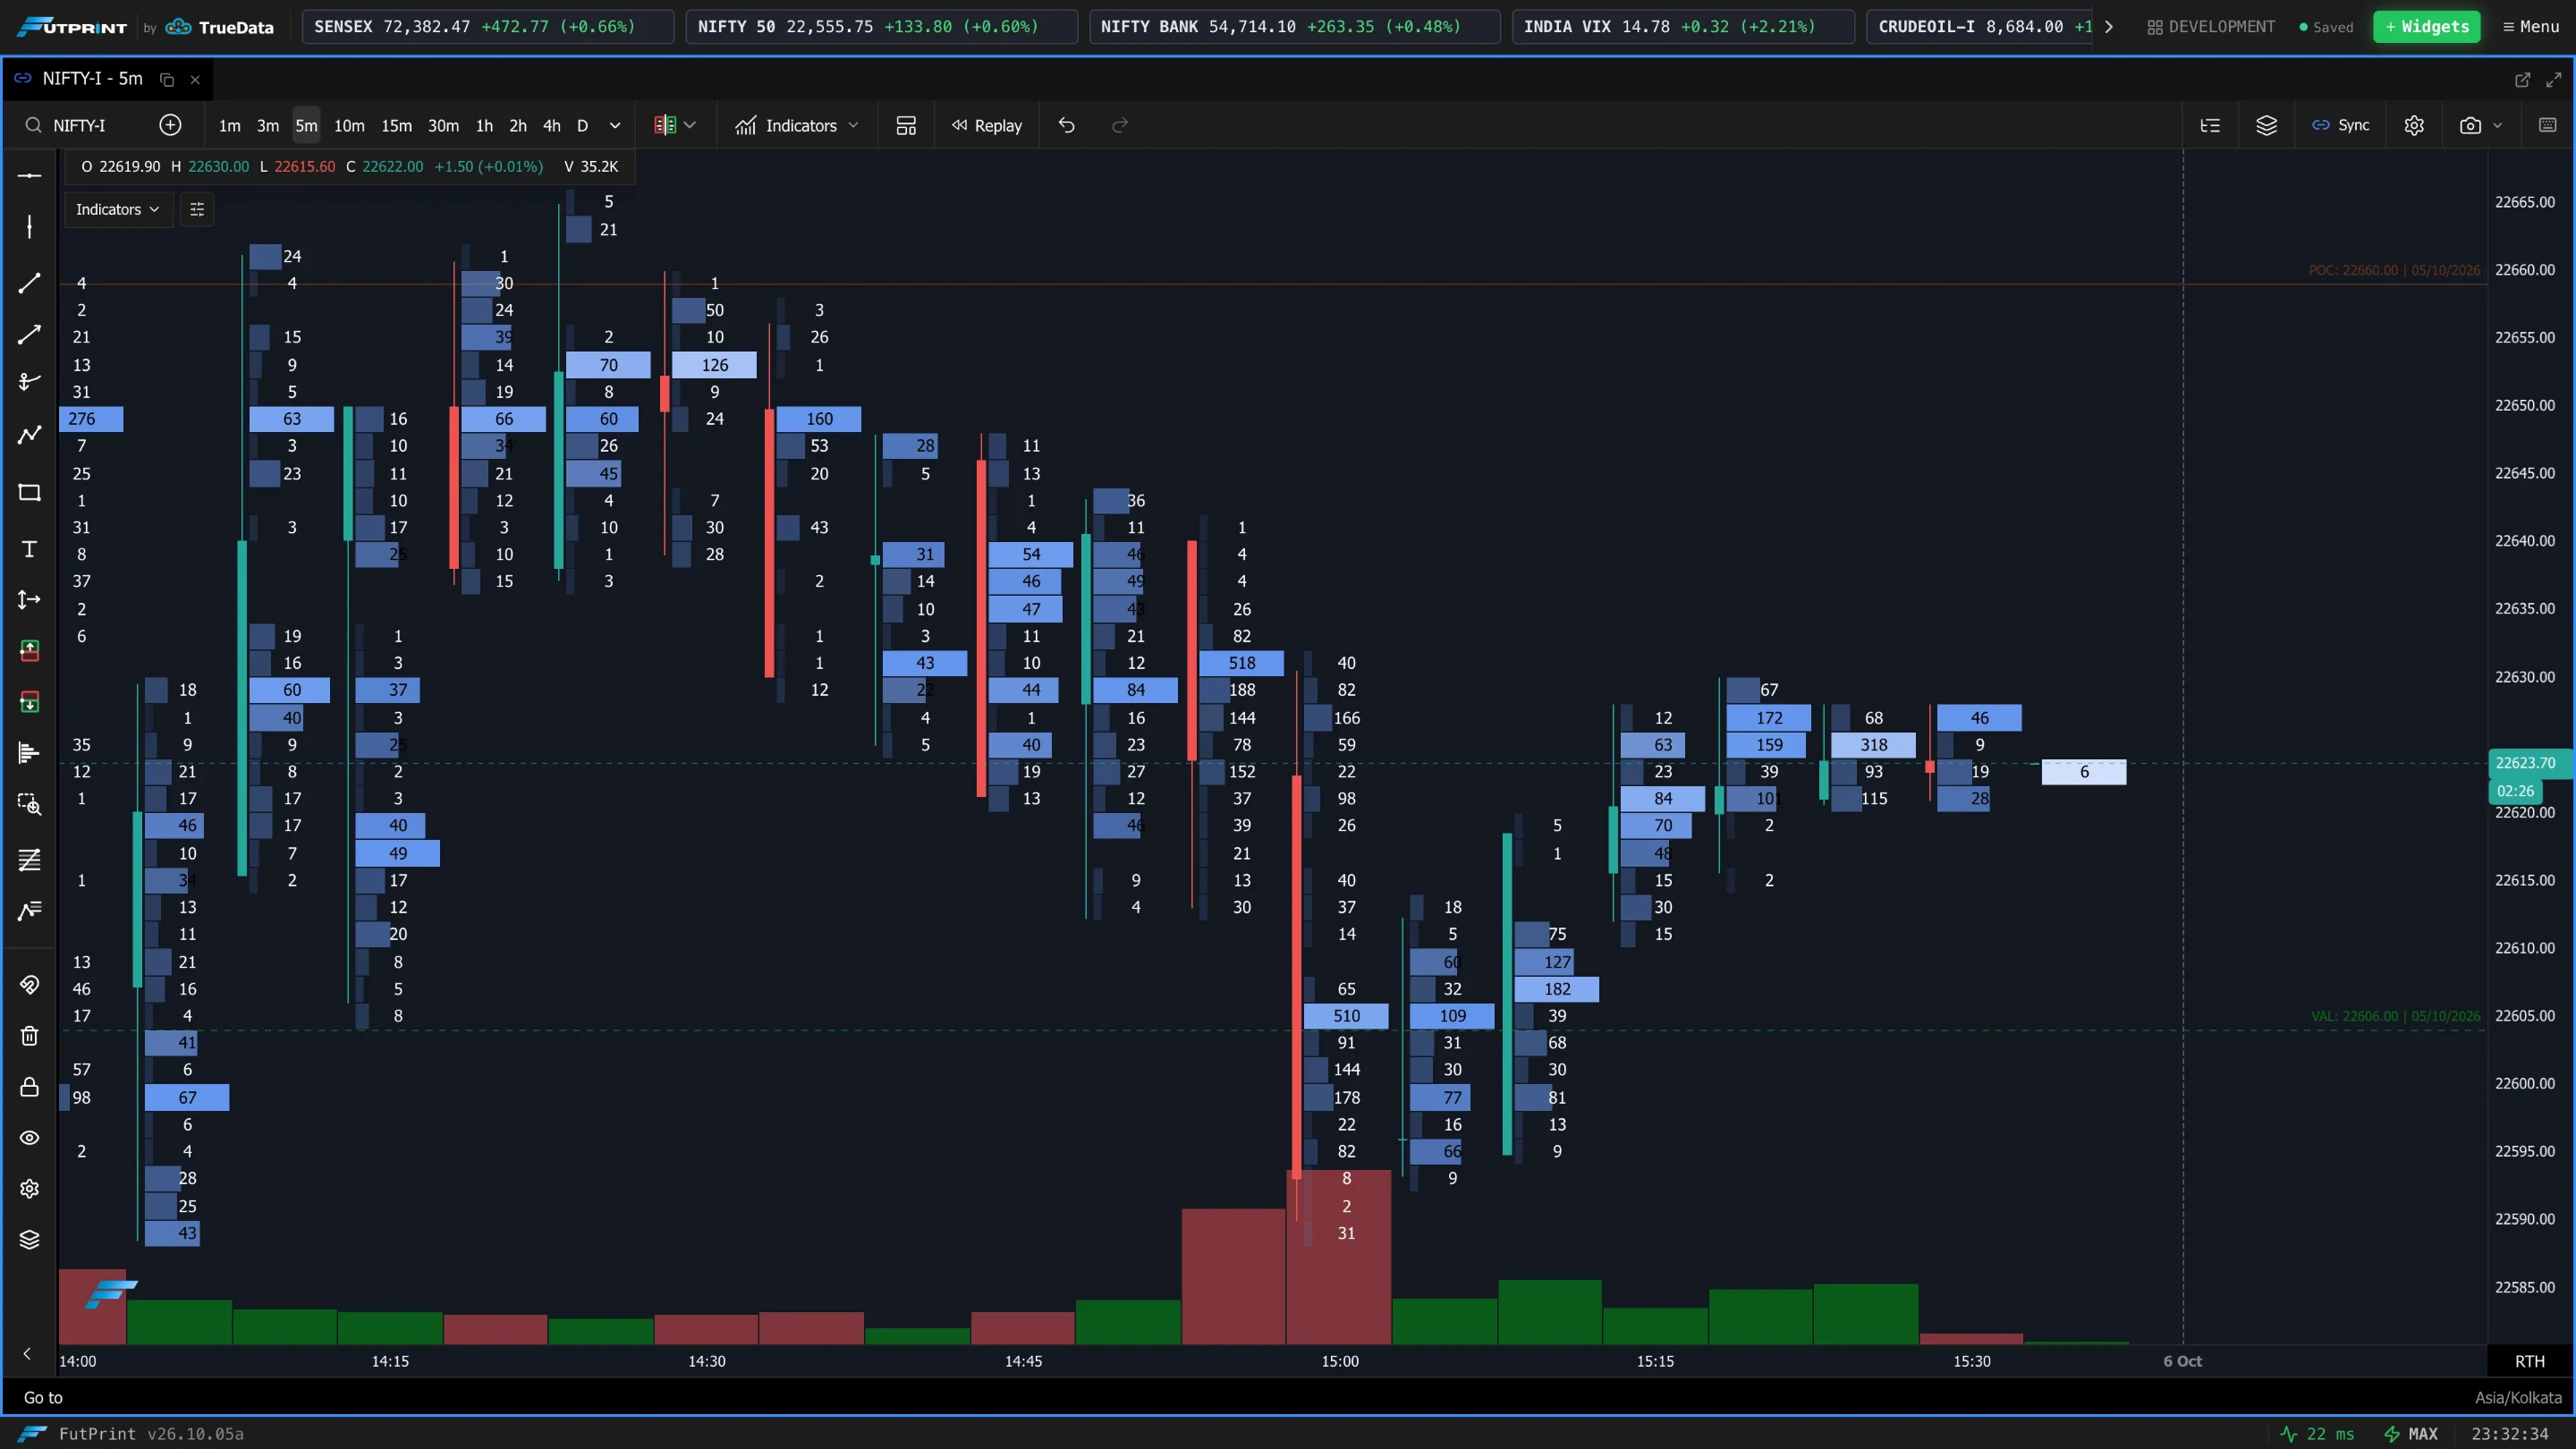
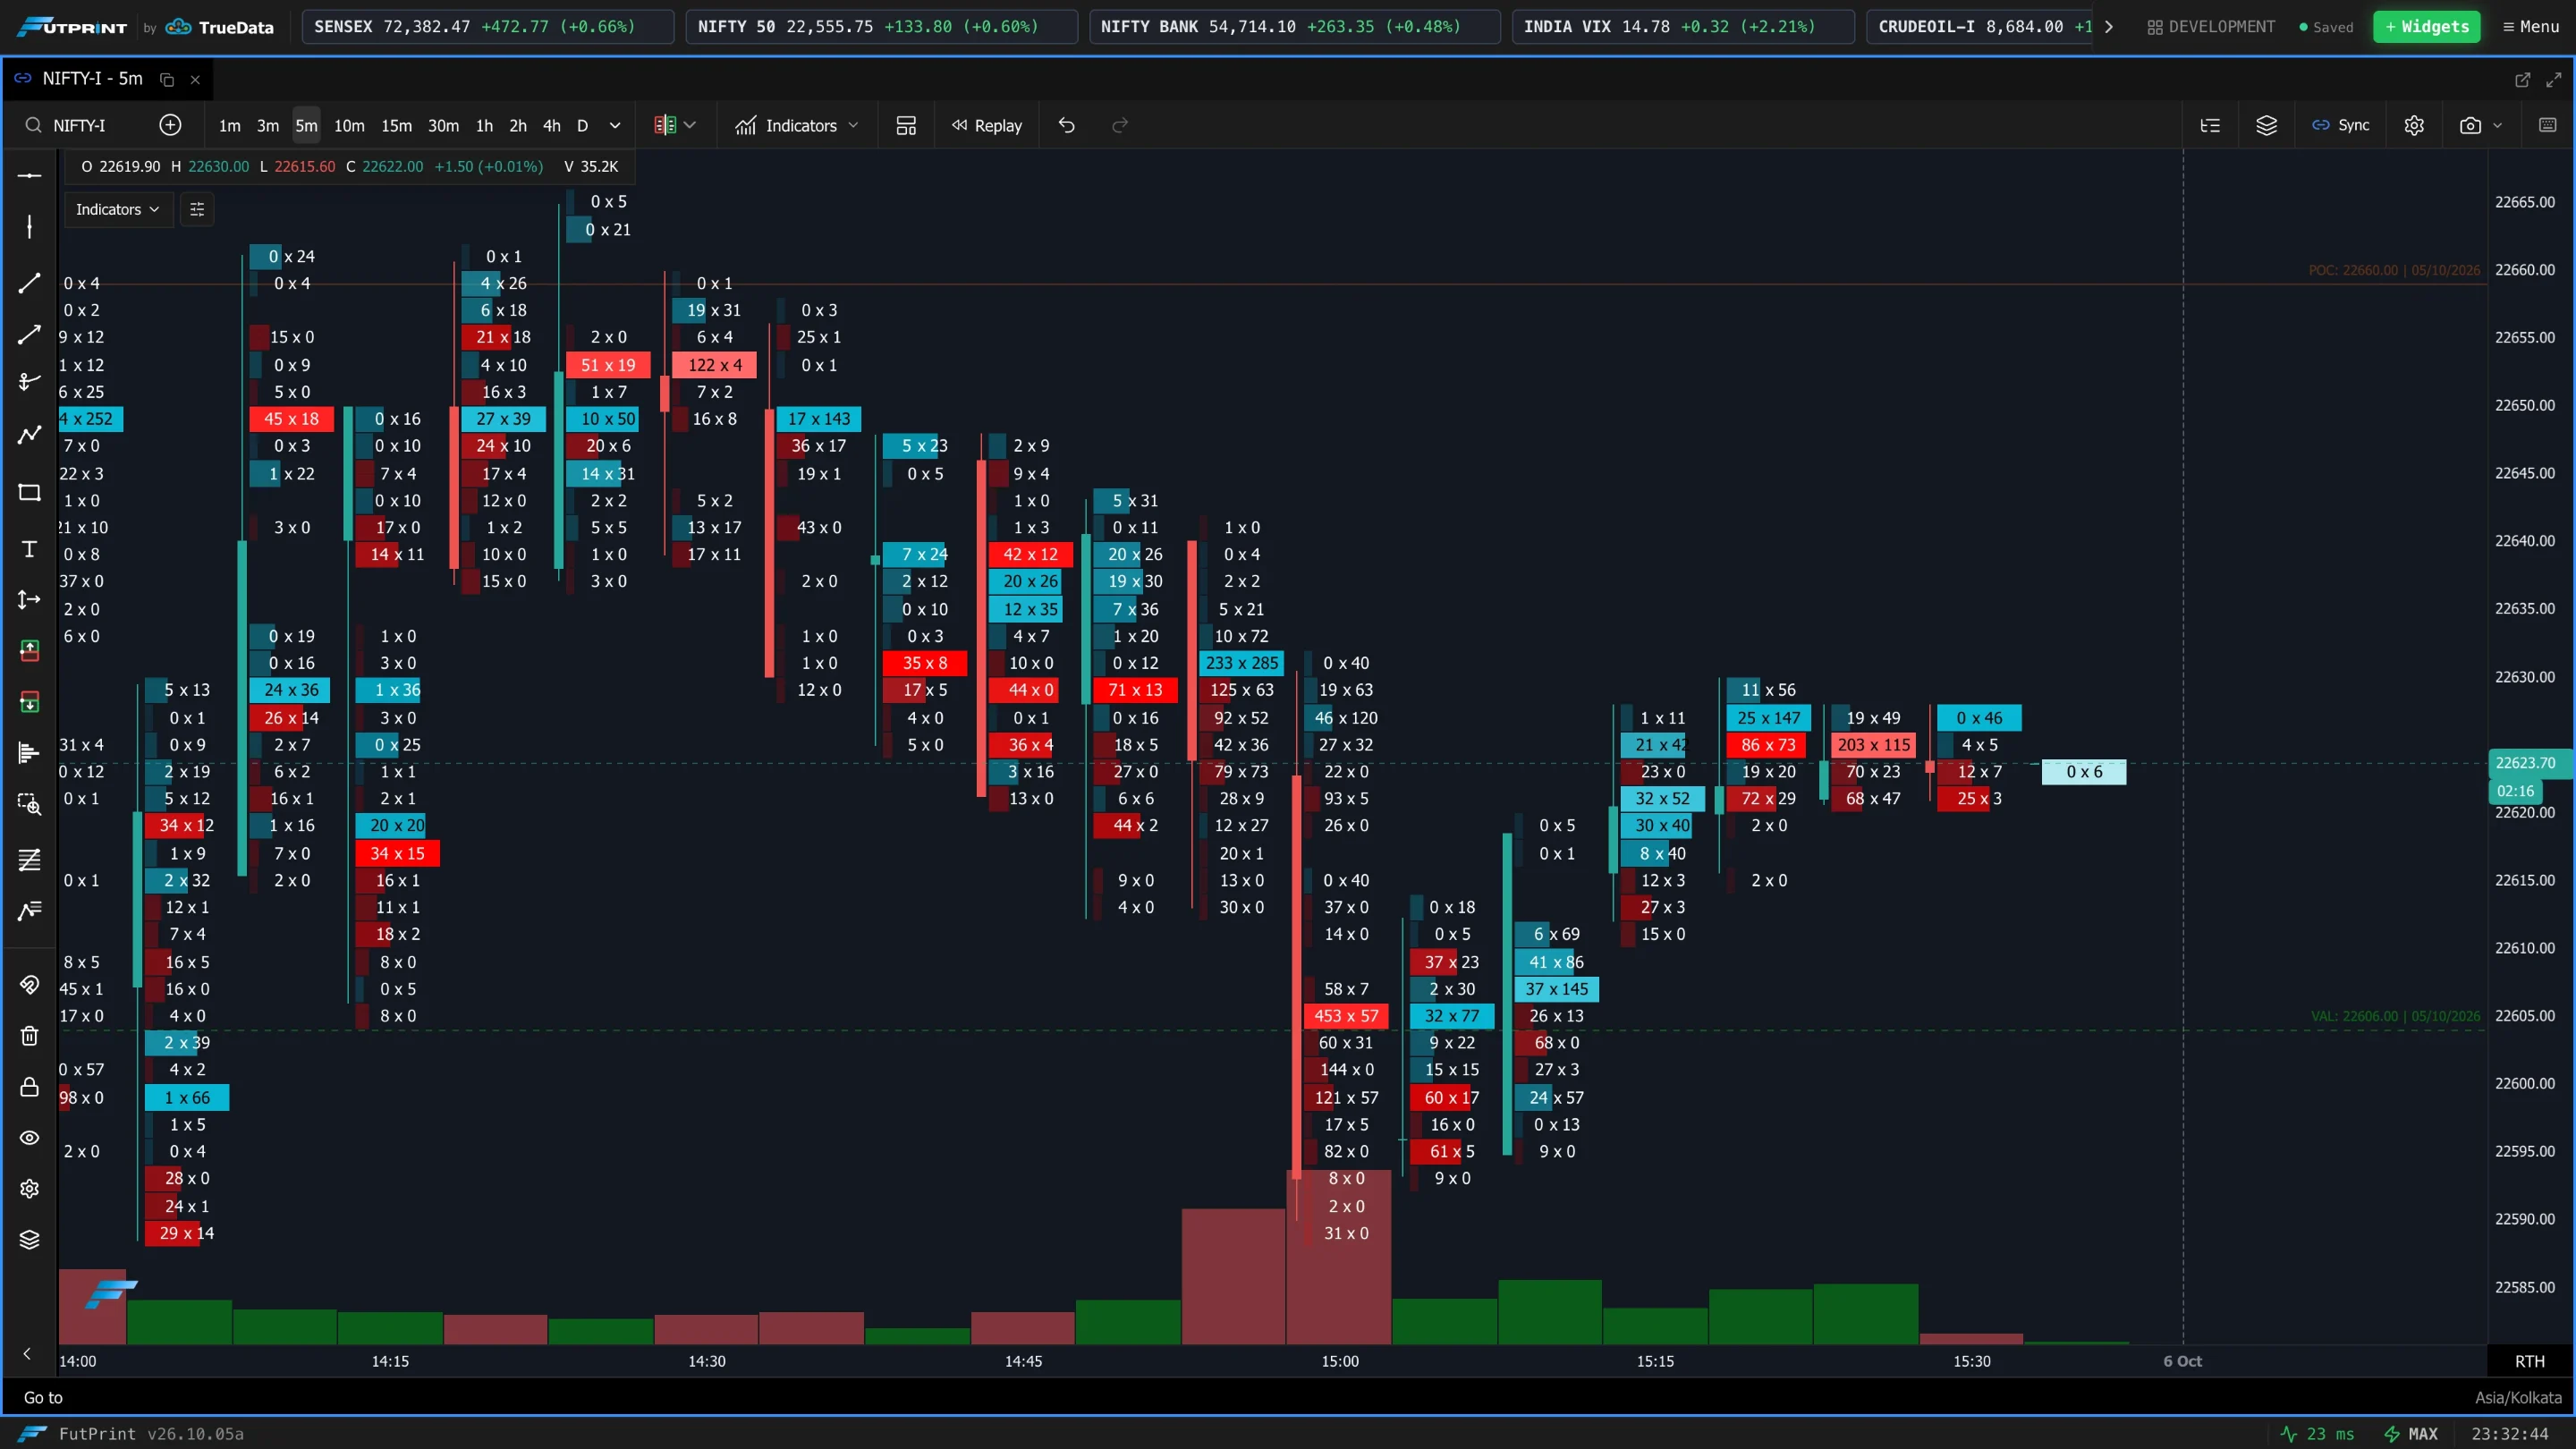
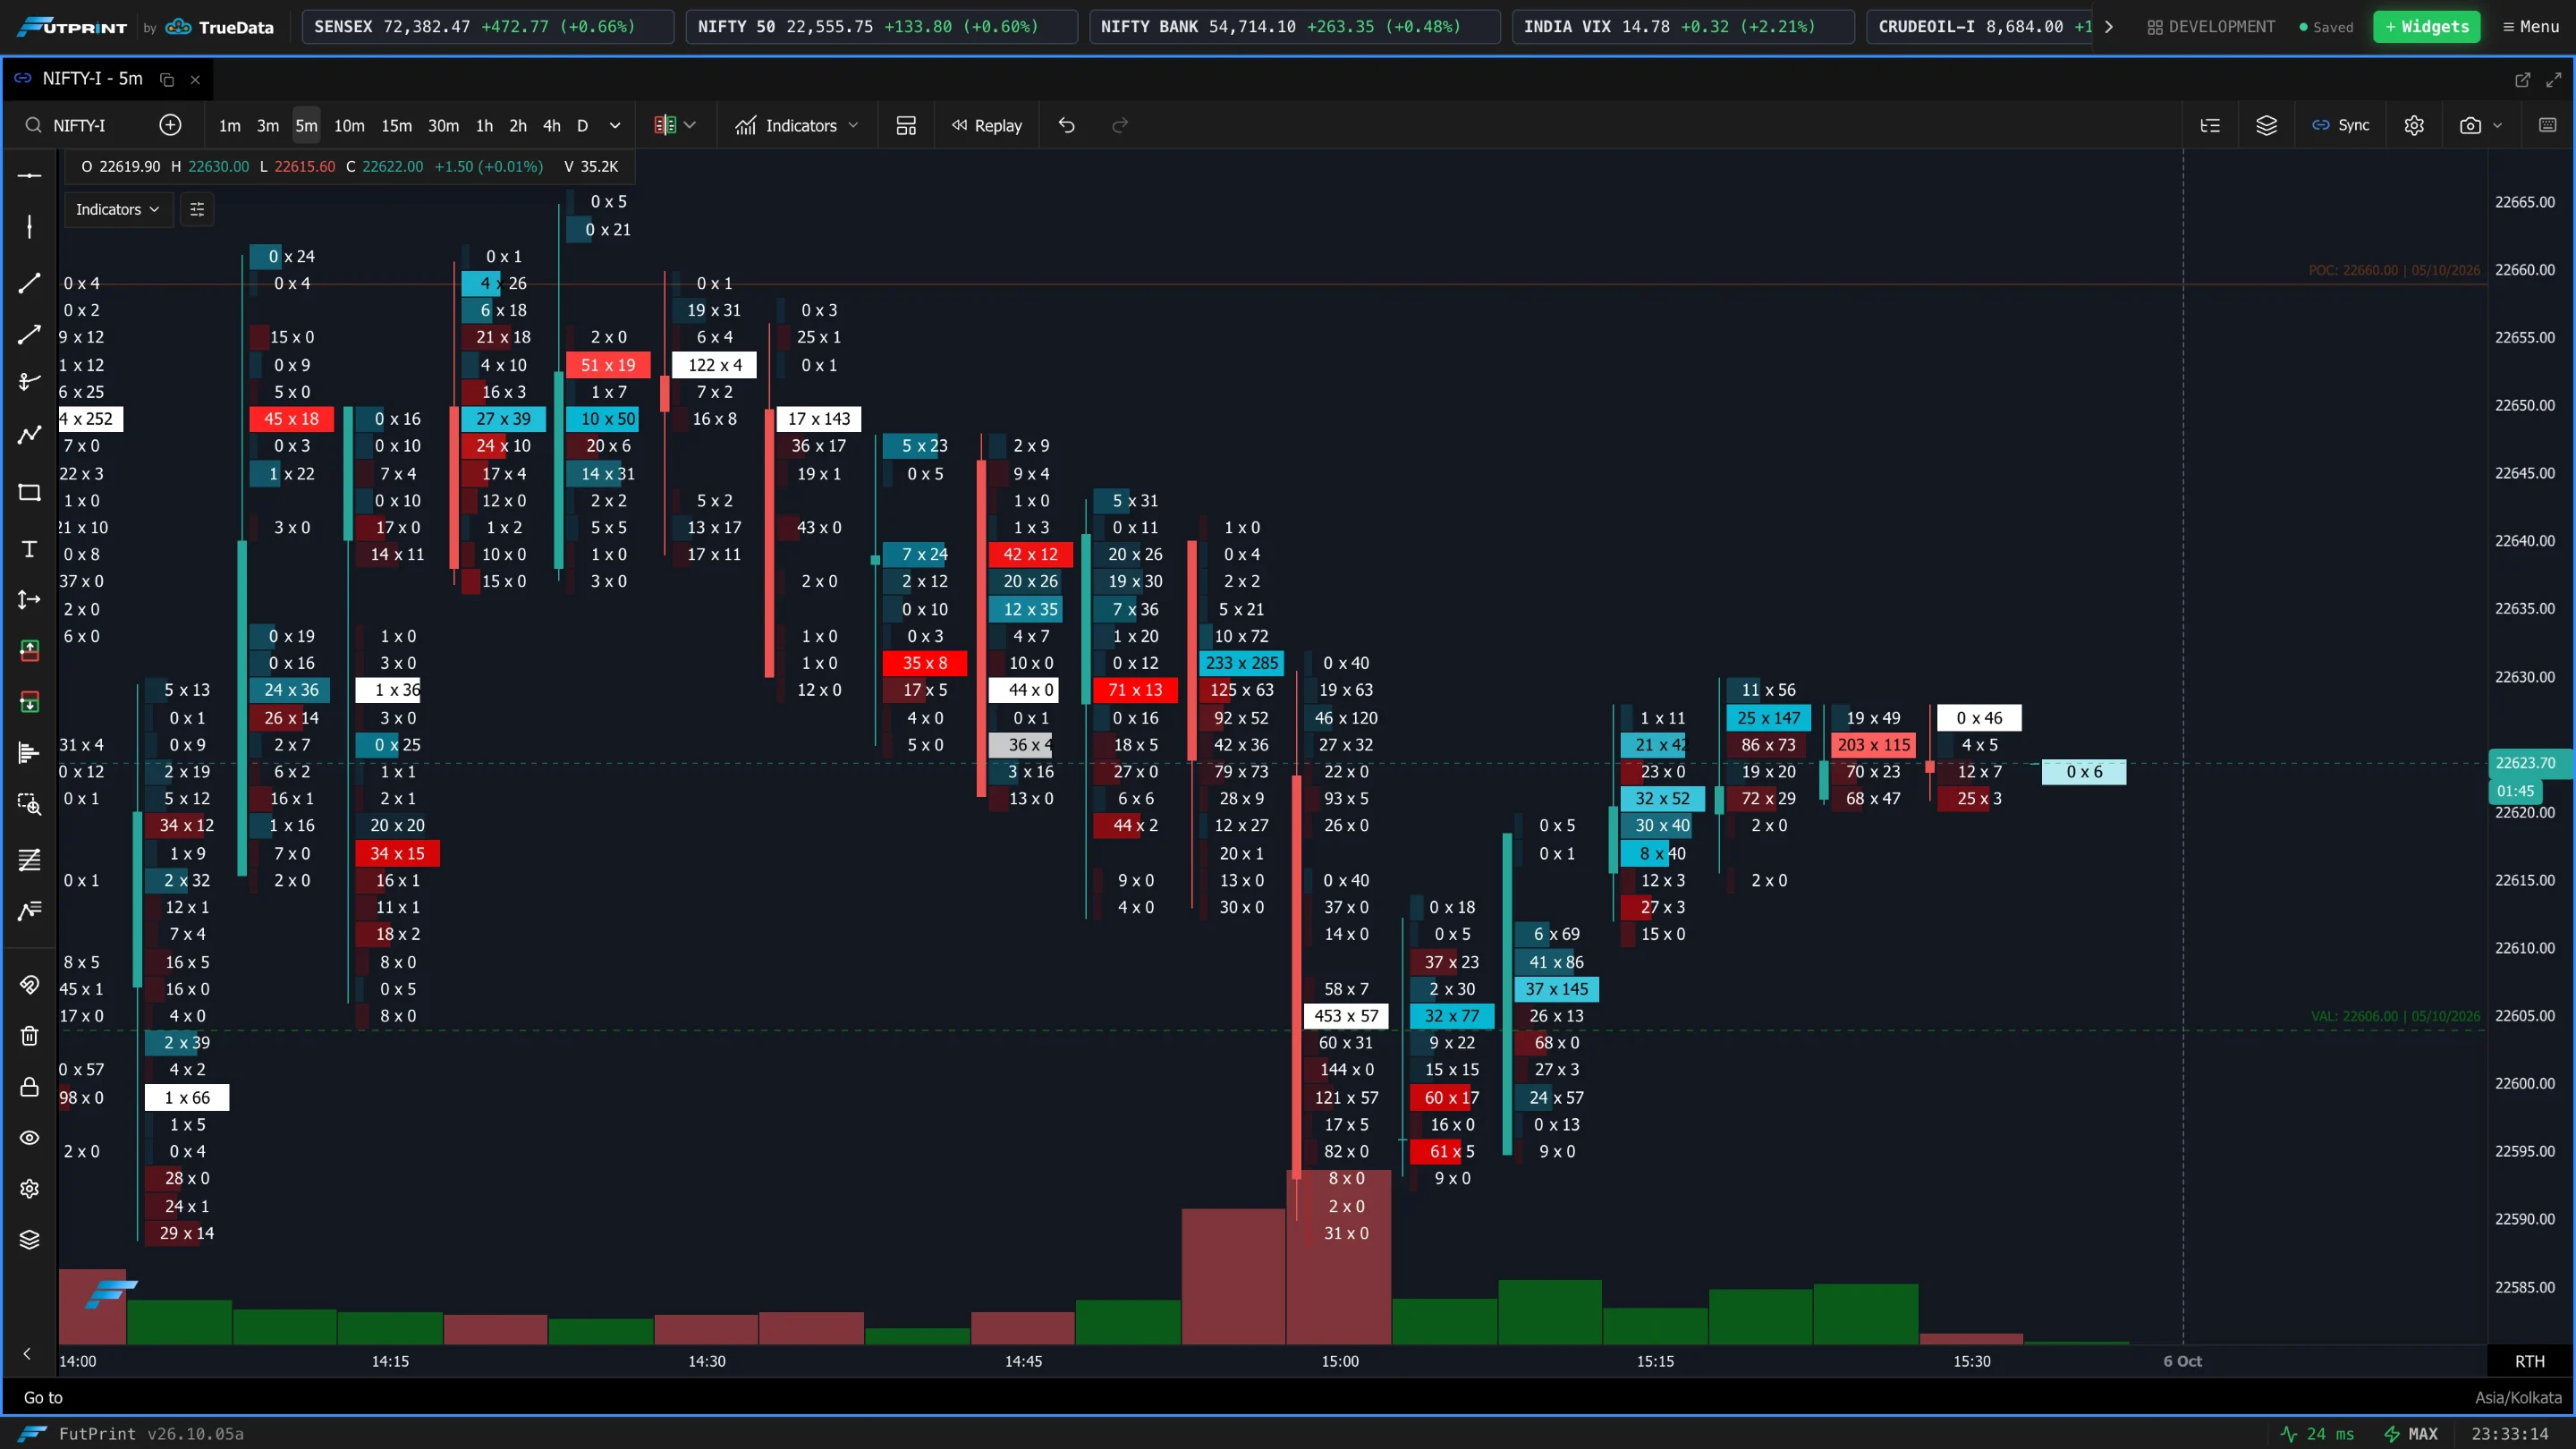
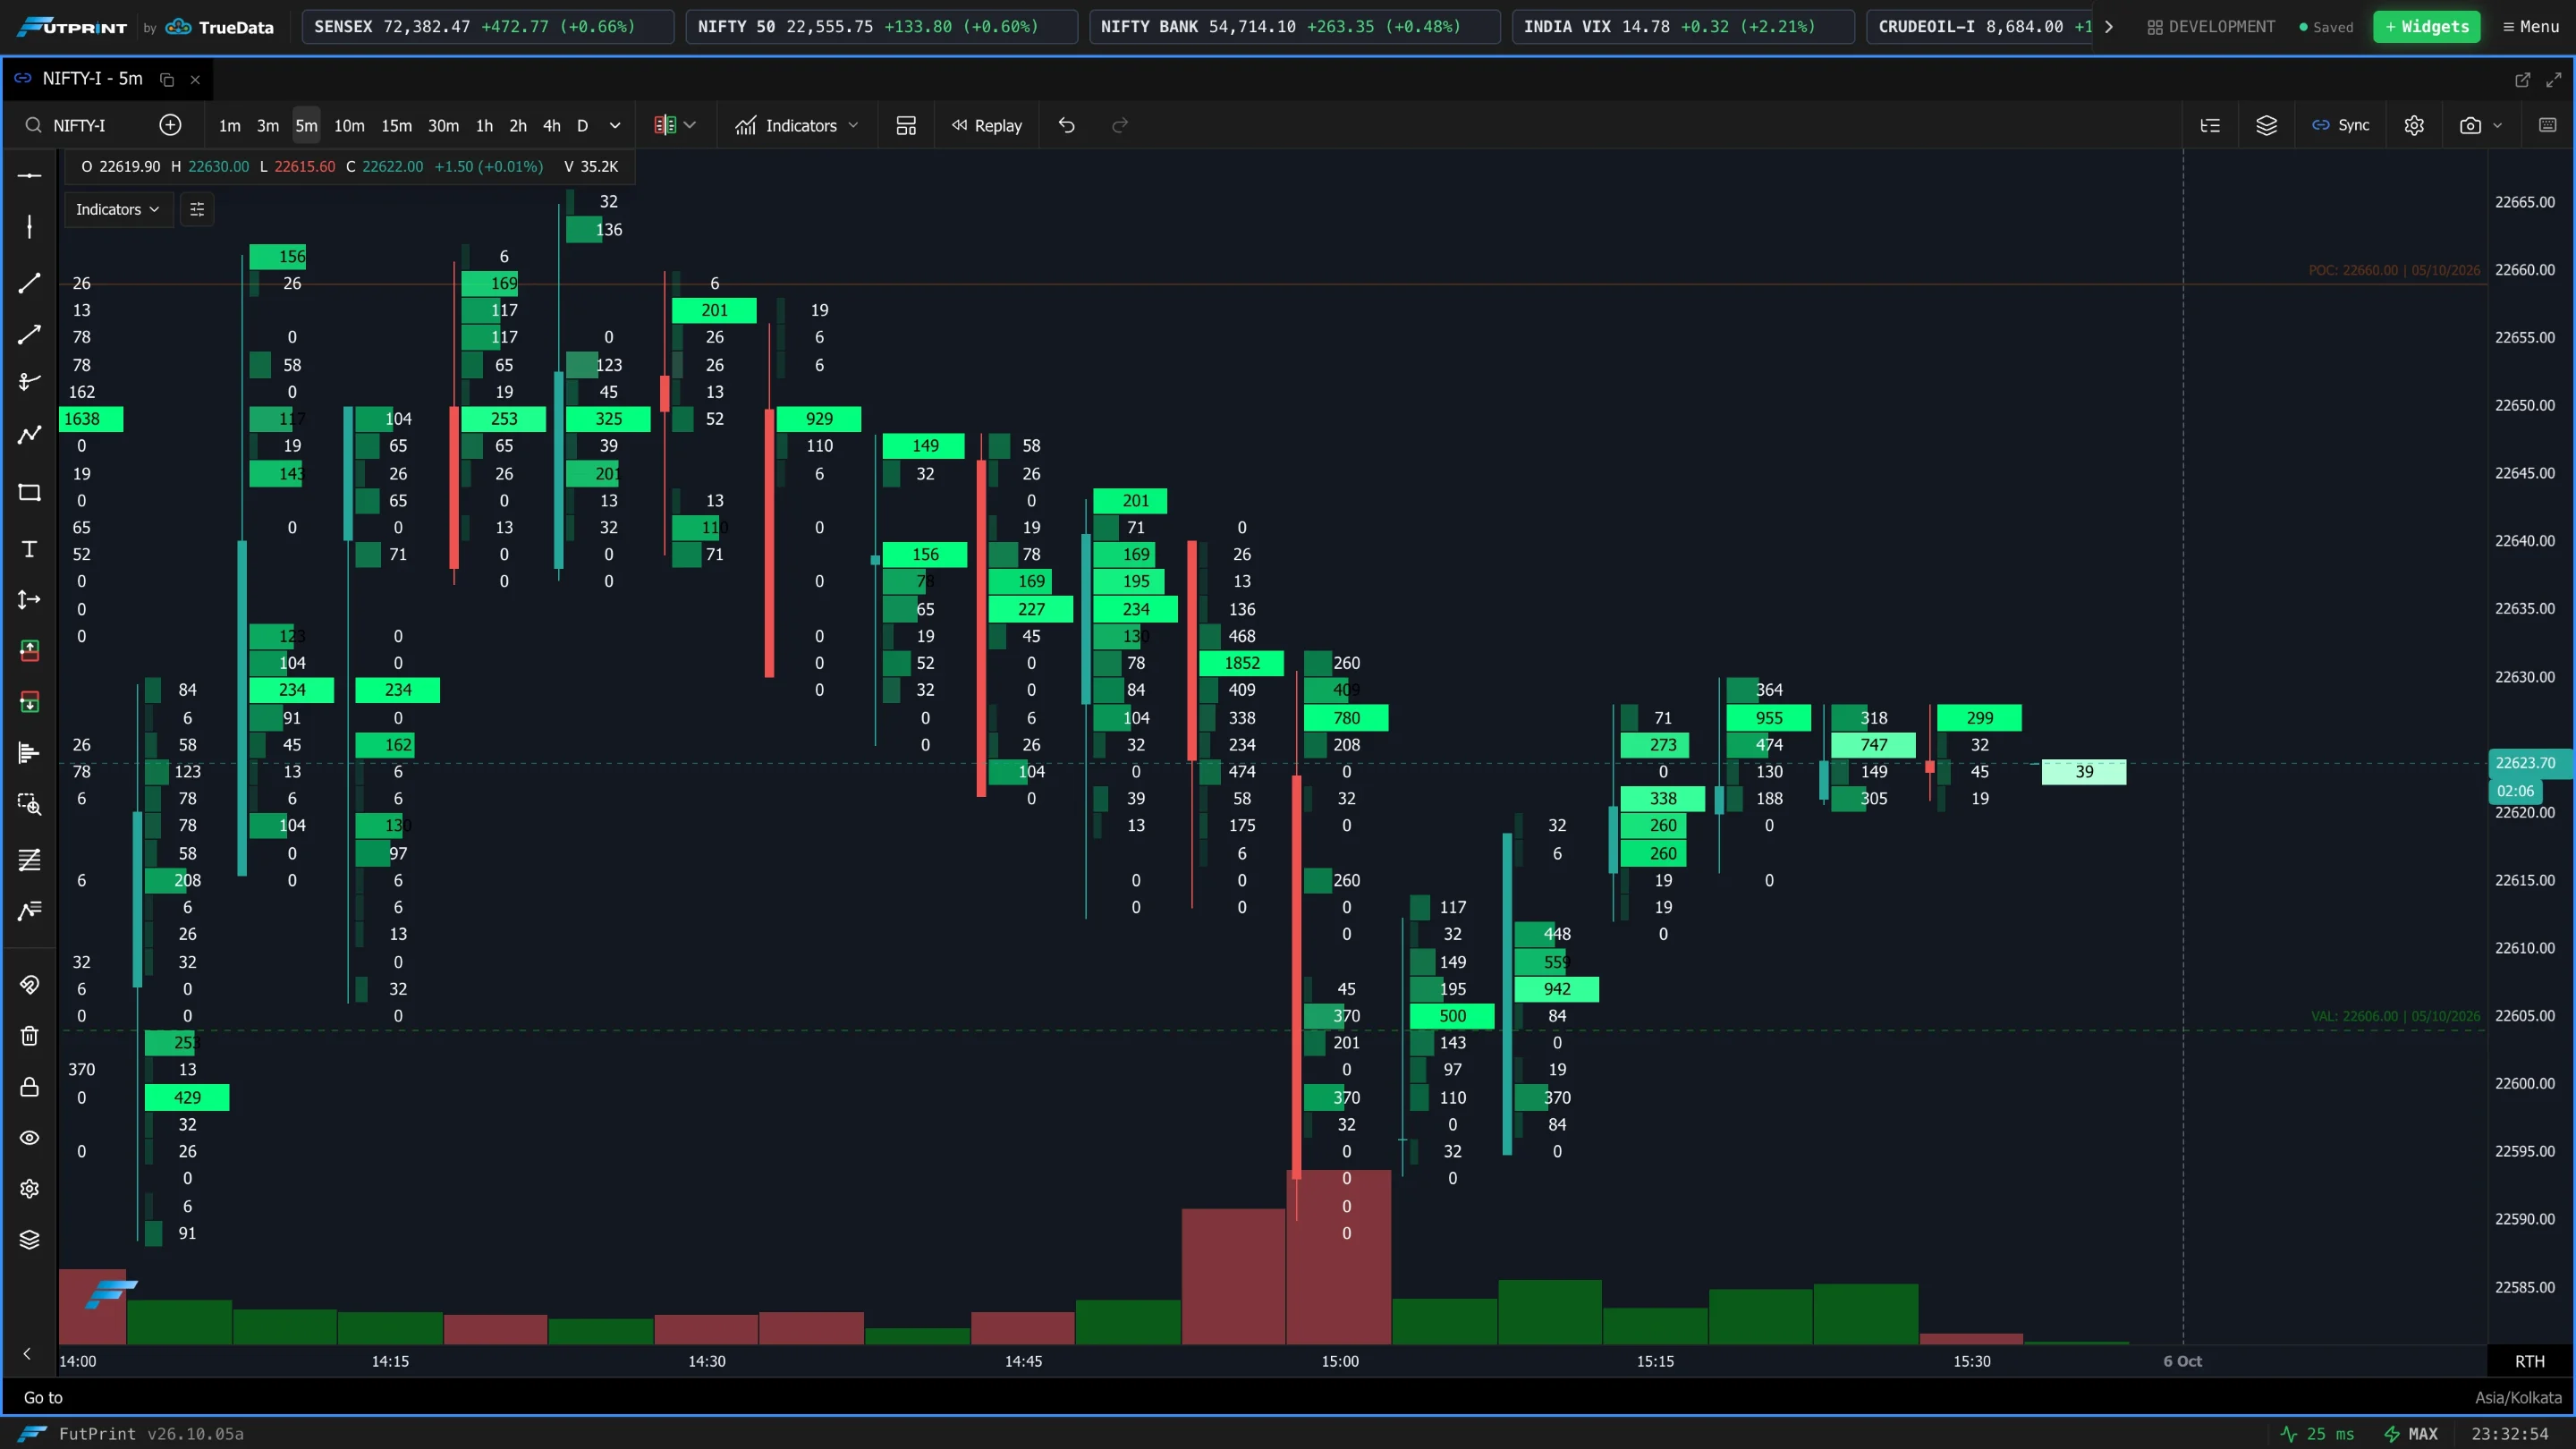
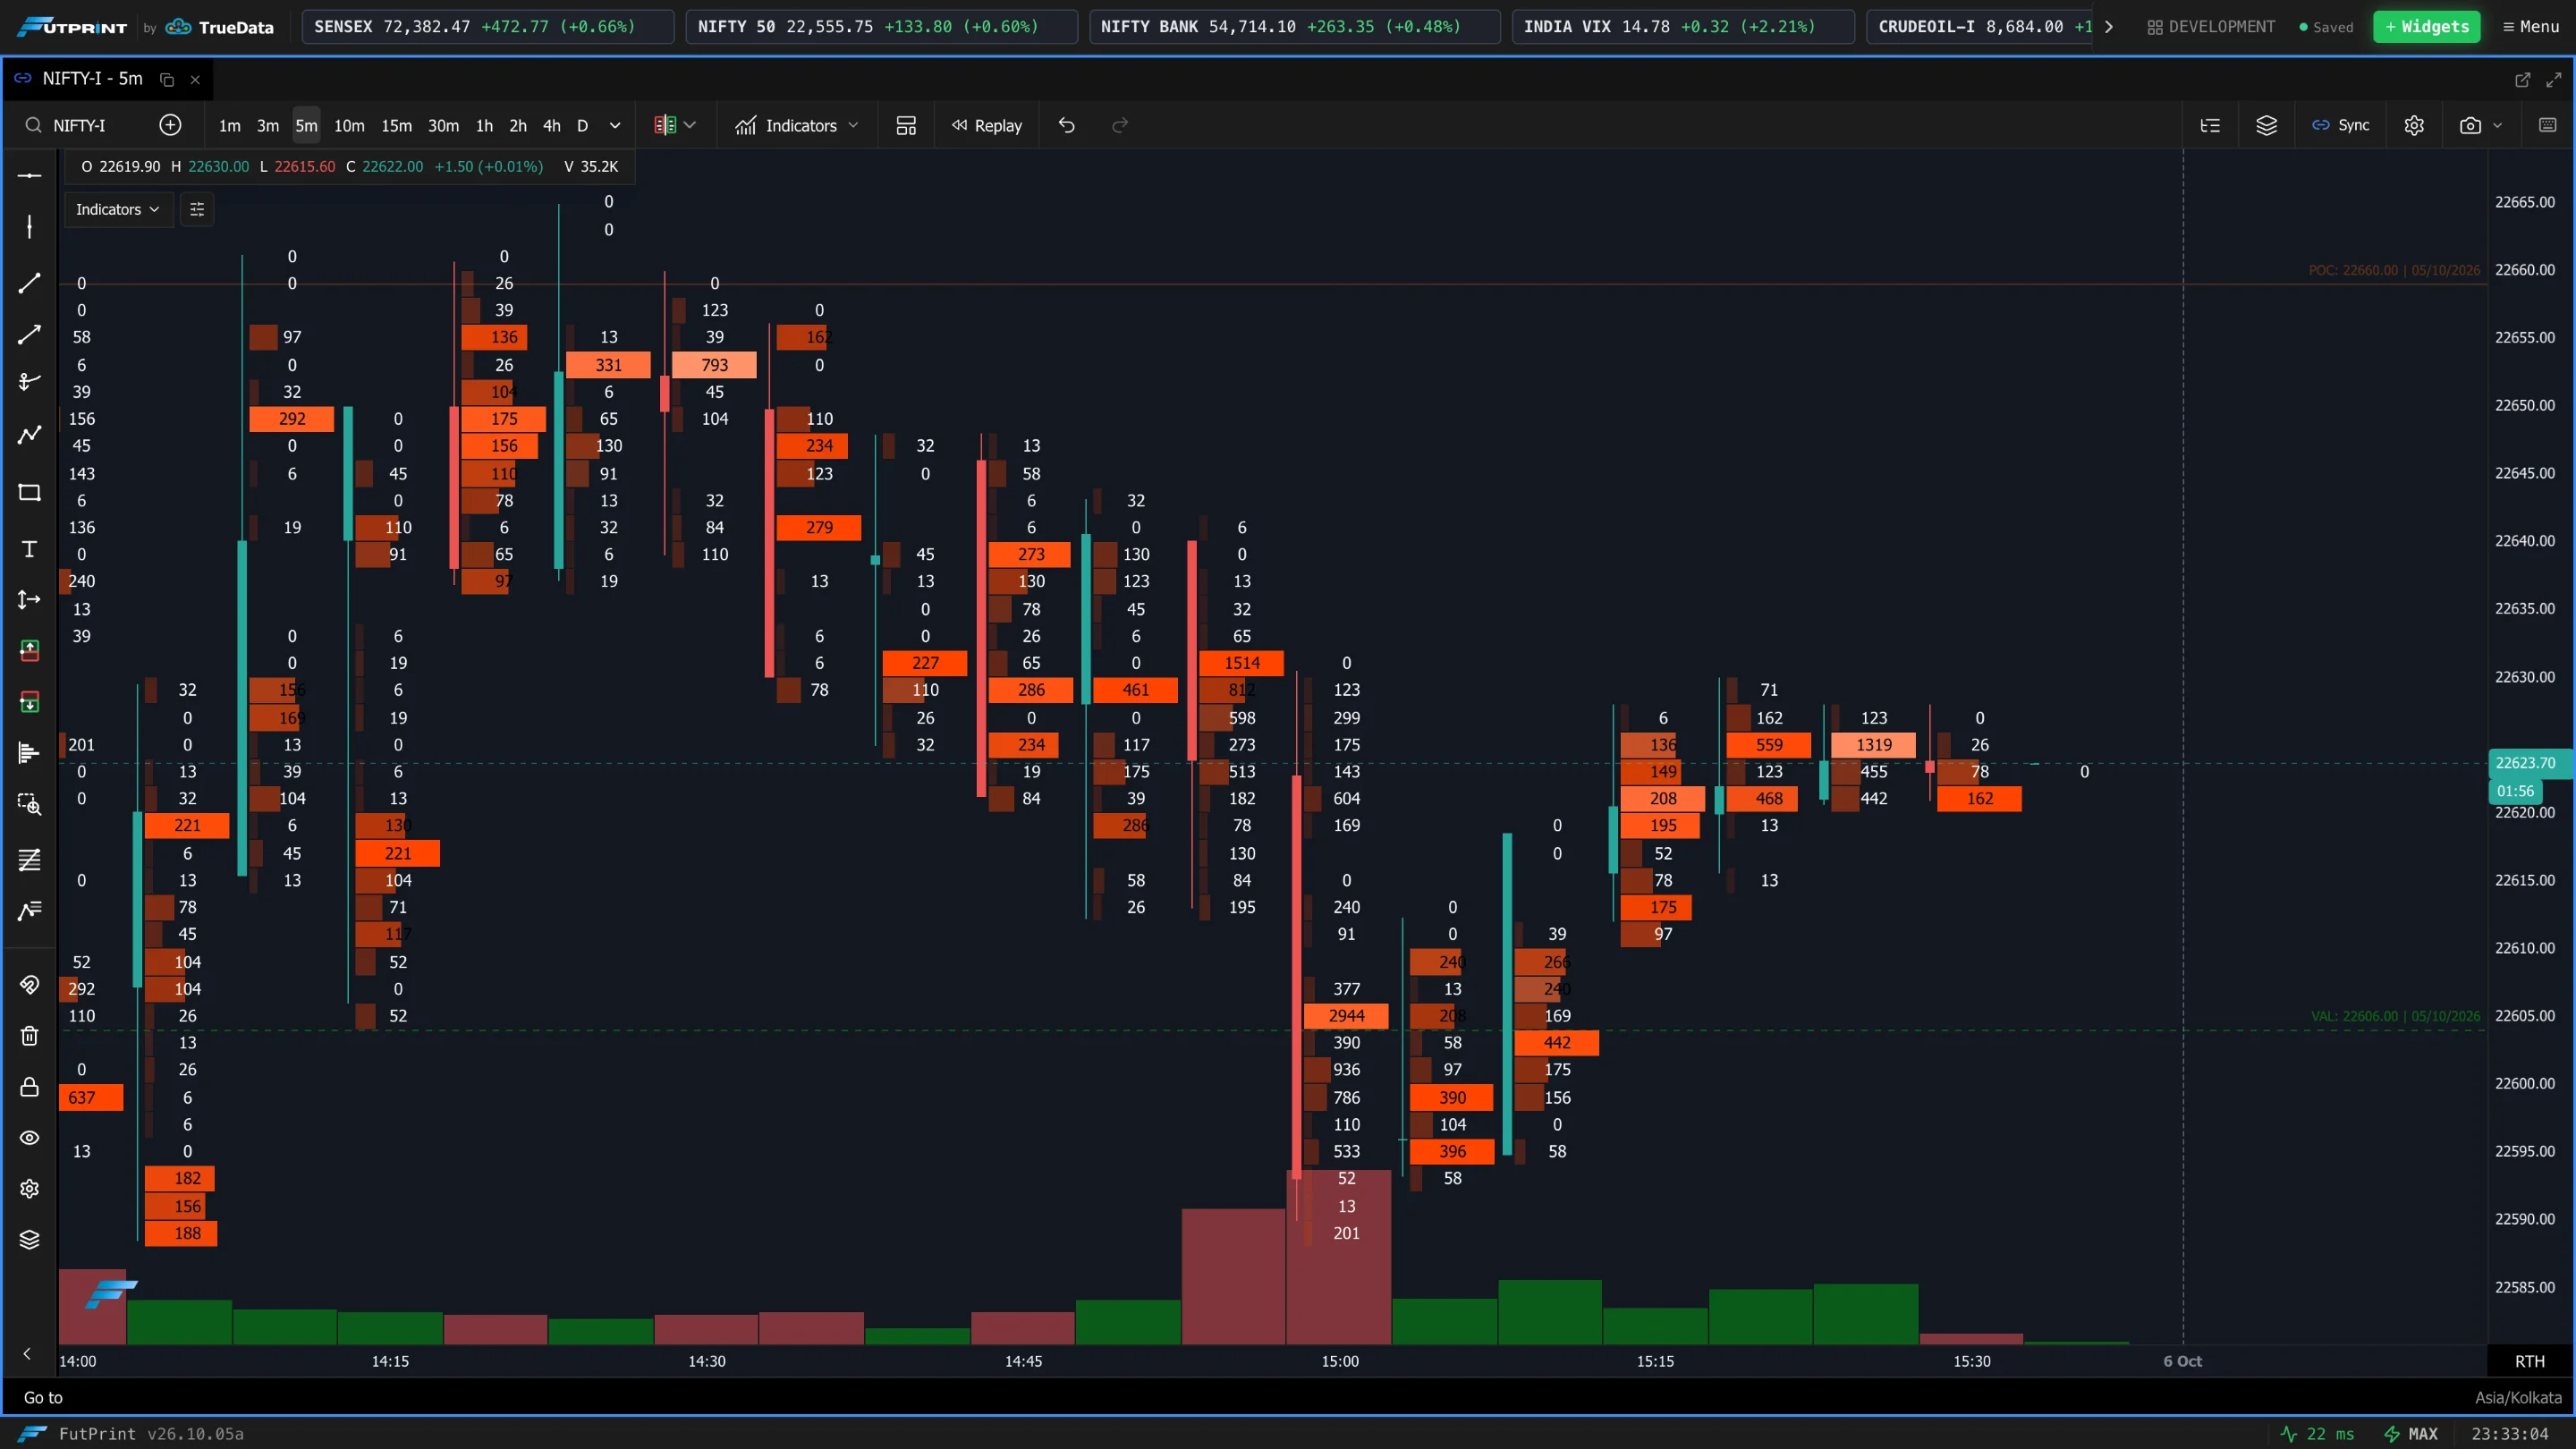
By convention the left column shows sell-side activity and the right shows buy-side, but every column can be set to any metric above for custom layouts.
Volume Colors
How the per-level values are coloured.
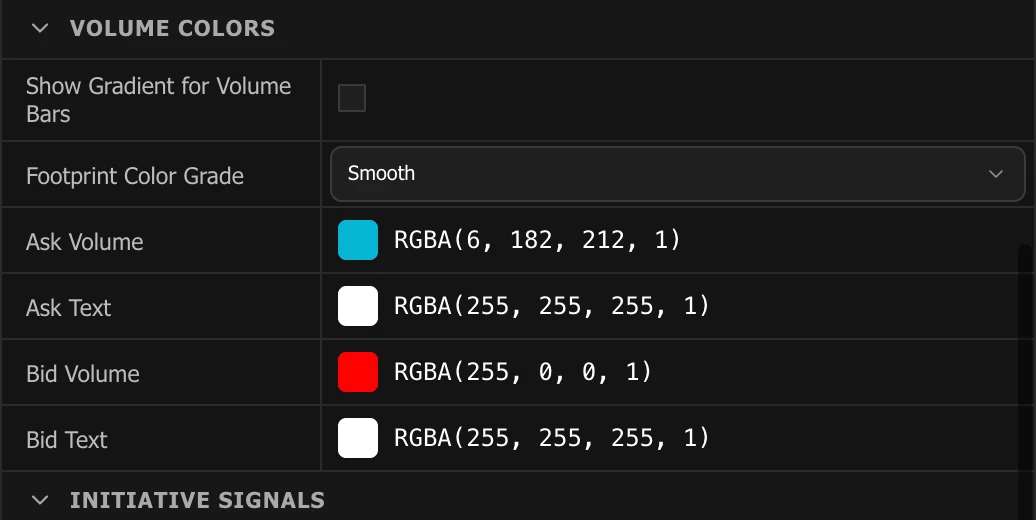
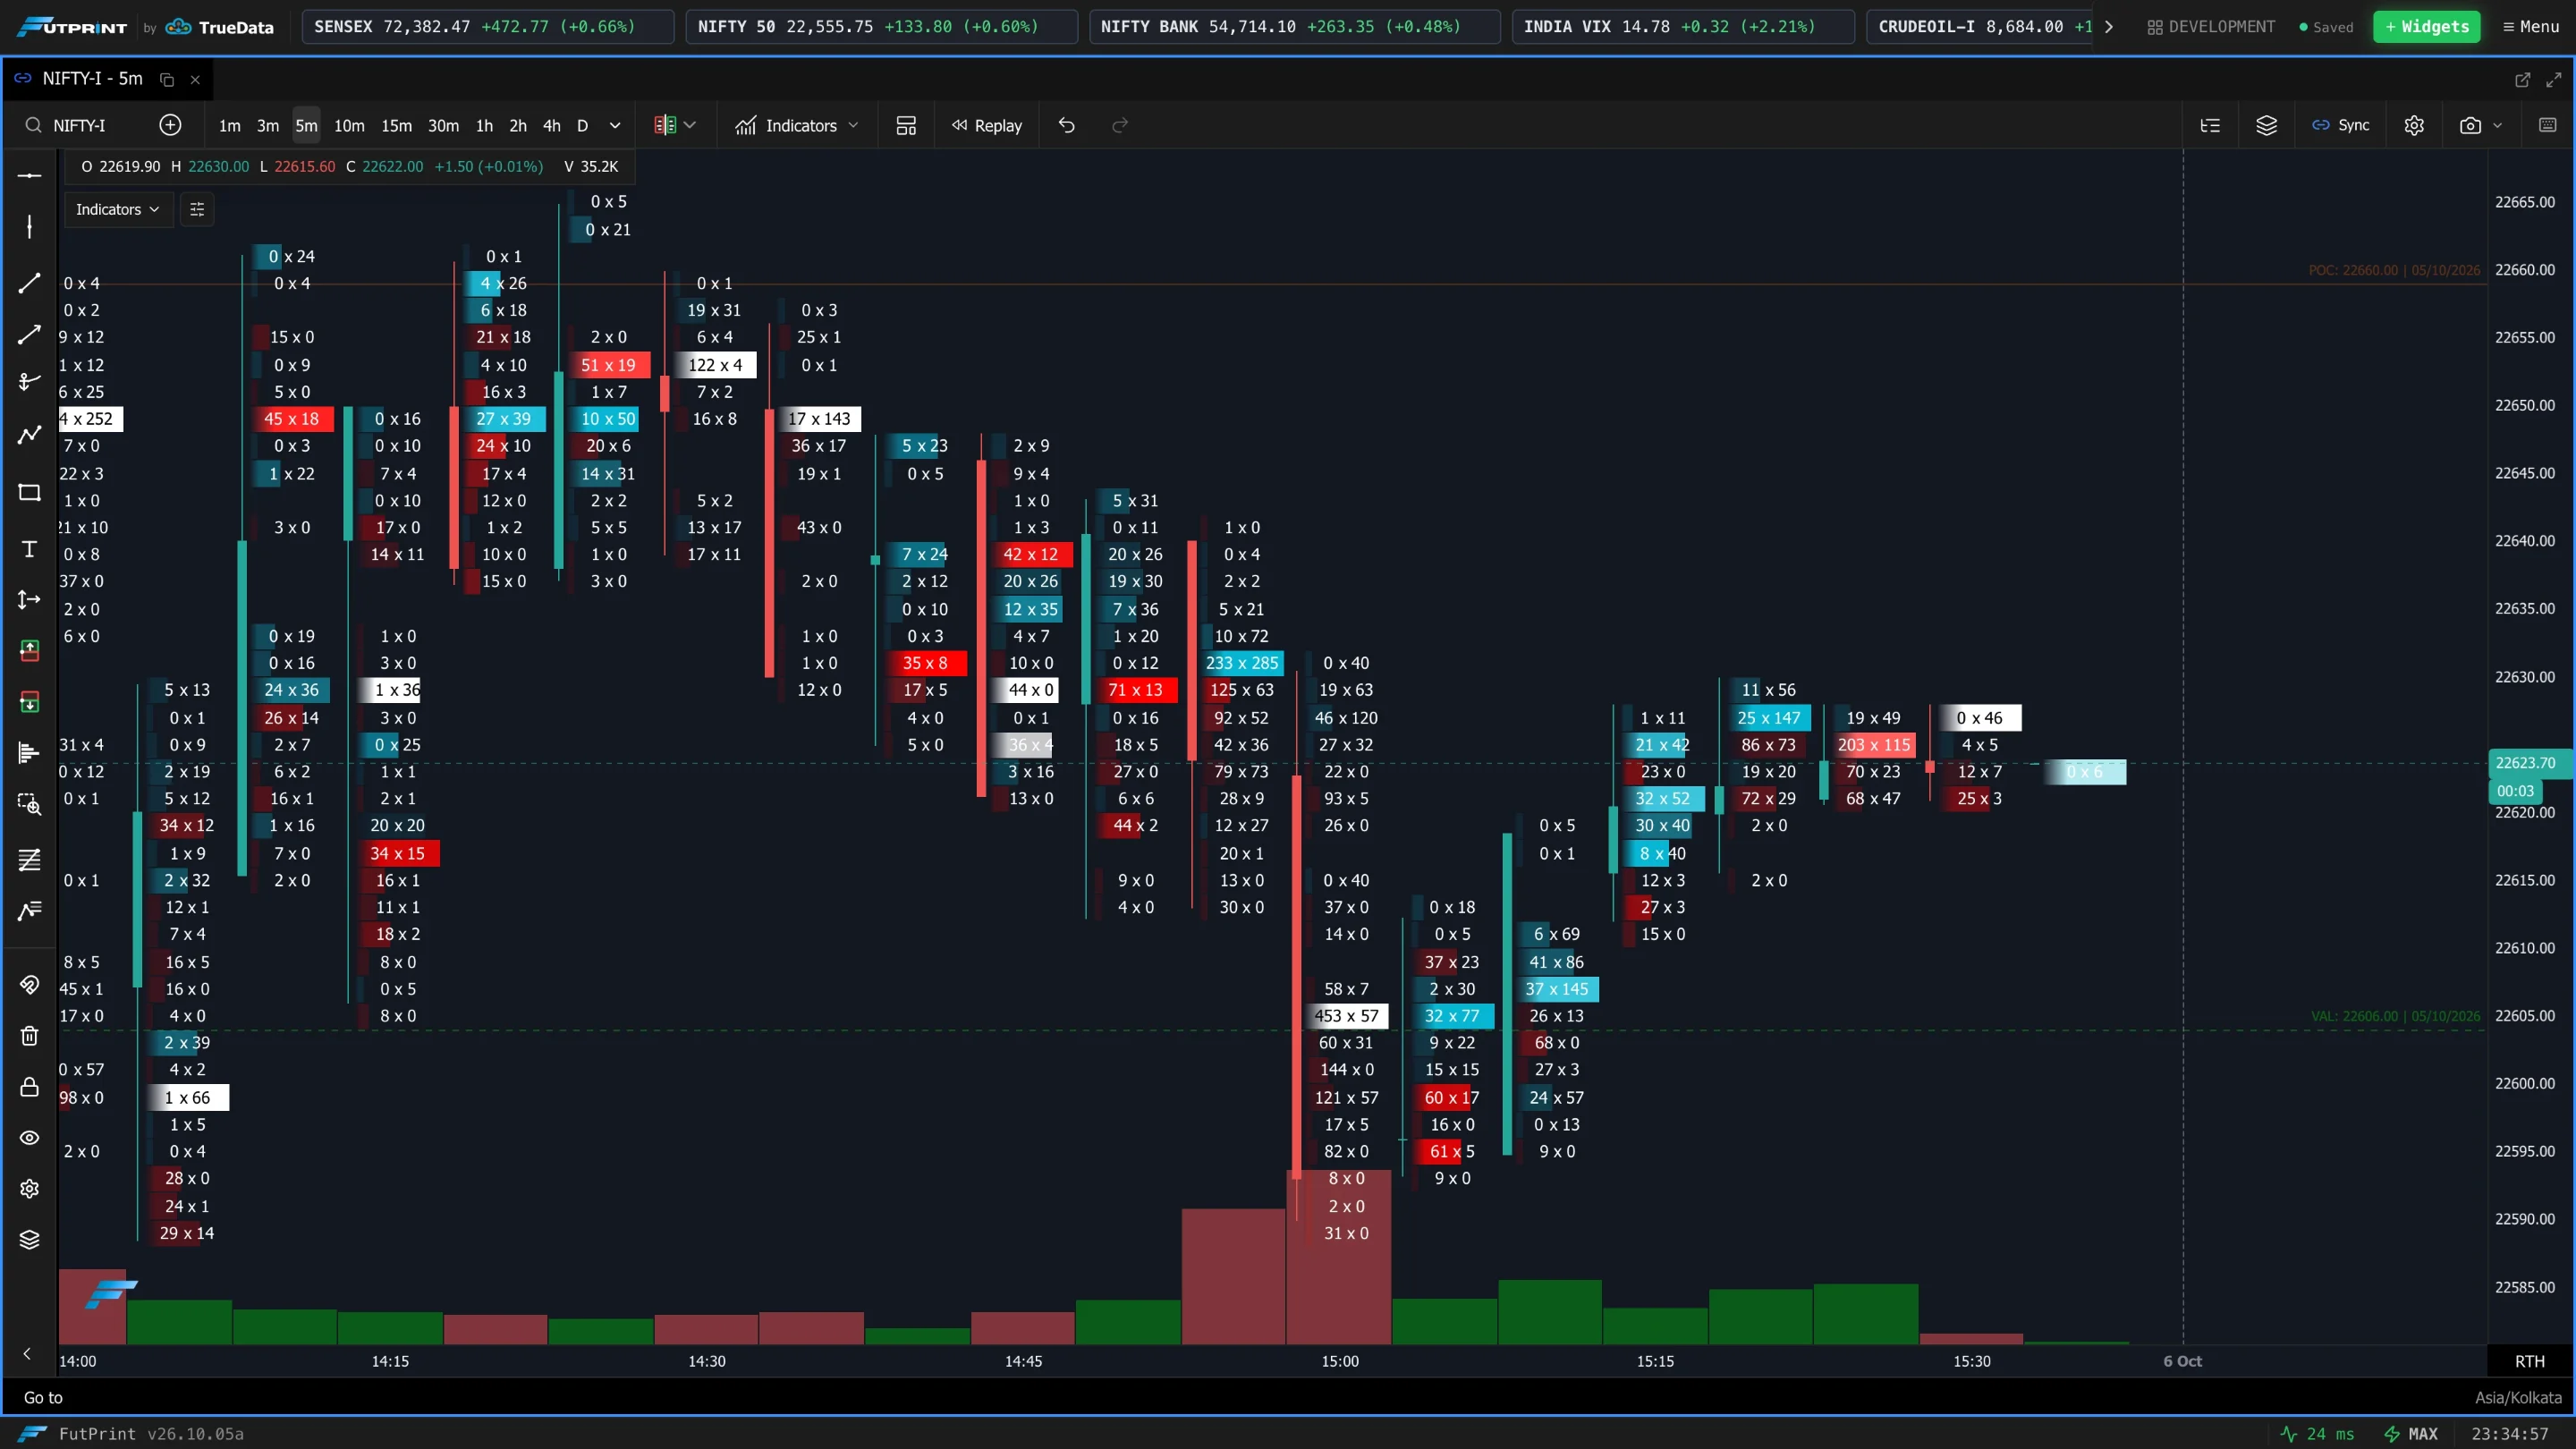
Show Gradient for Volume Bars
When on, volume bars fade from the background colour to the volume colour (a gradient); when off, bars use a flat solid colour.
Footprint Color Grade
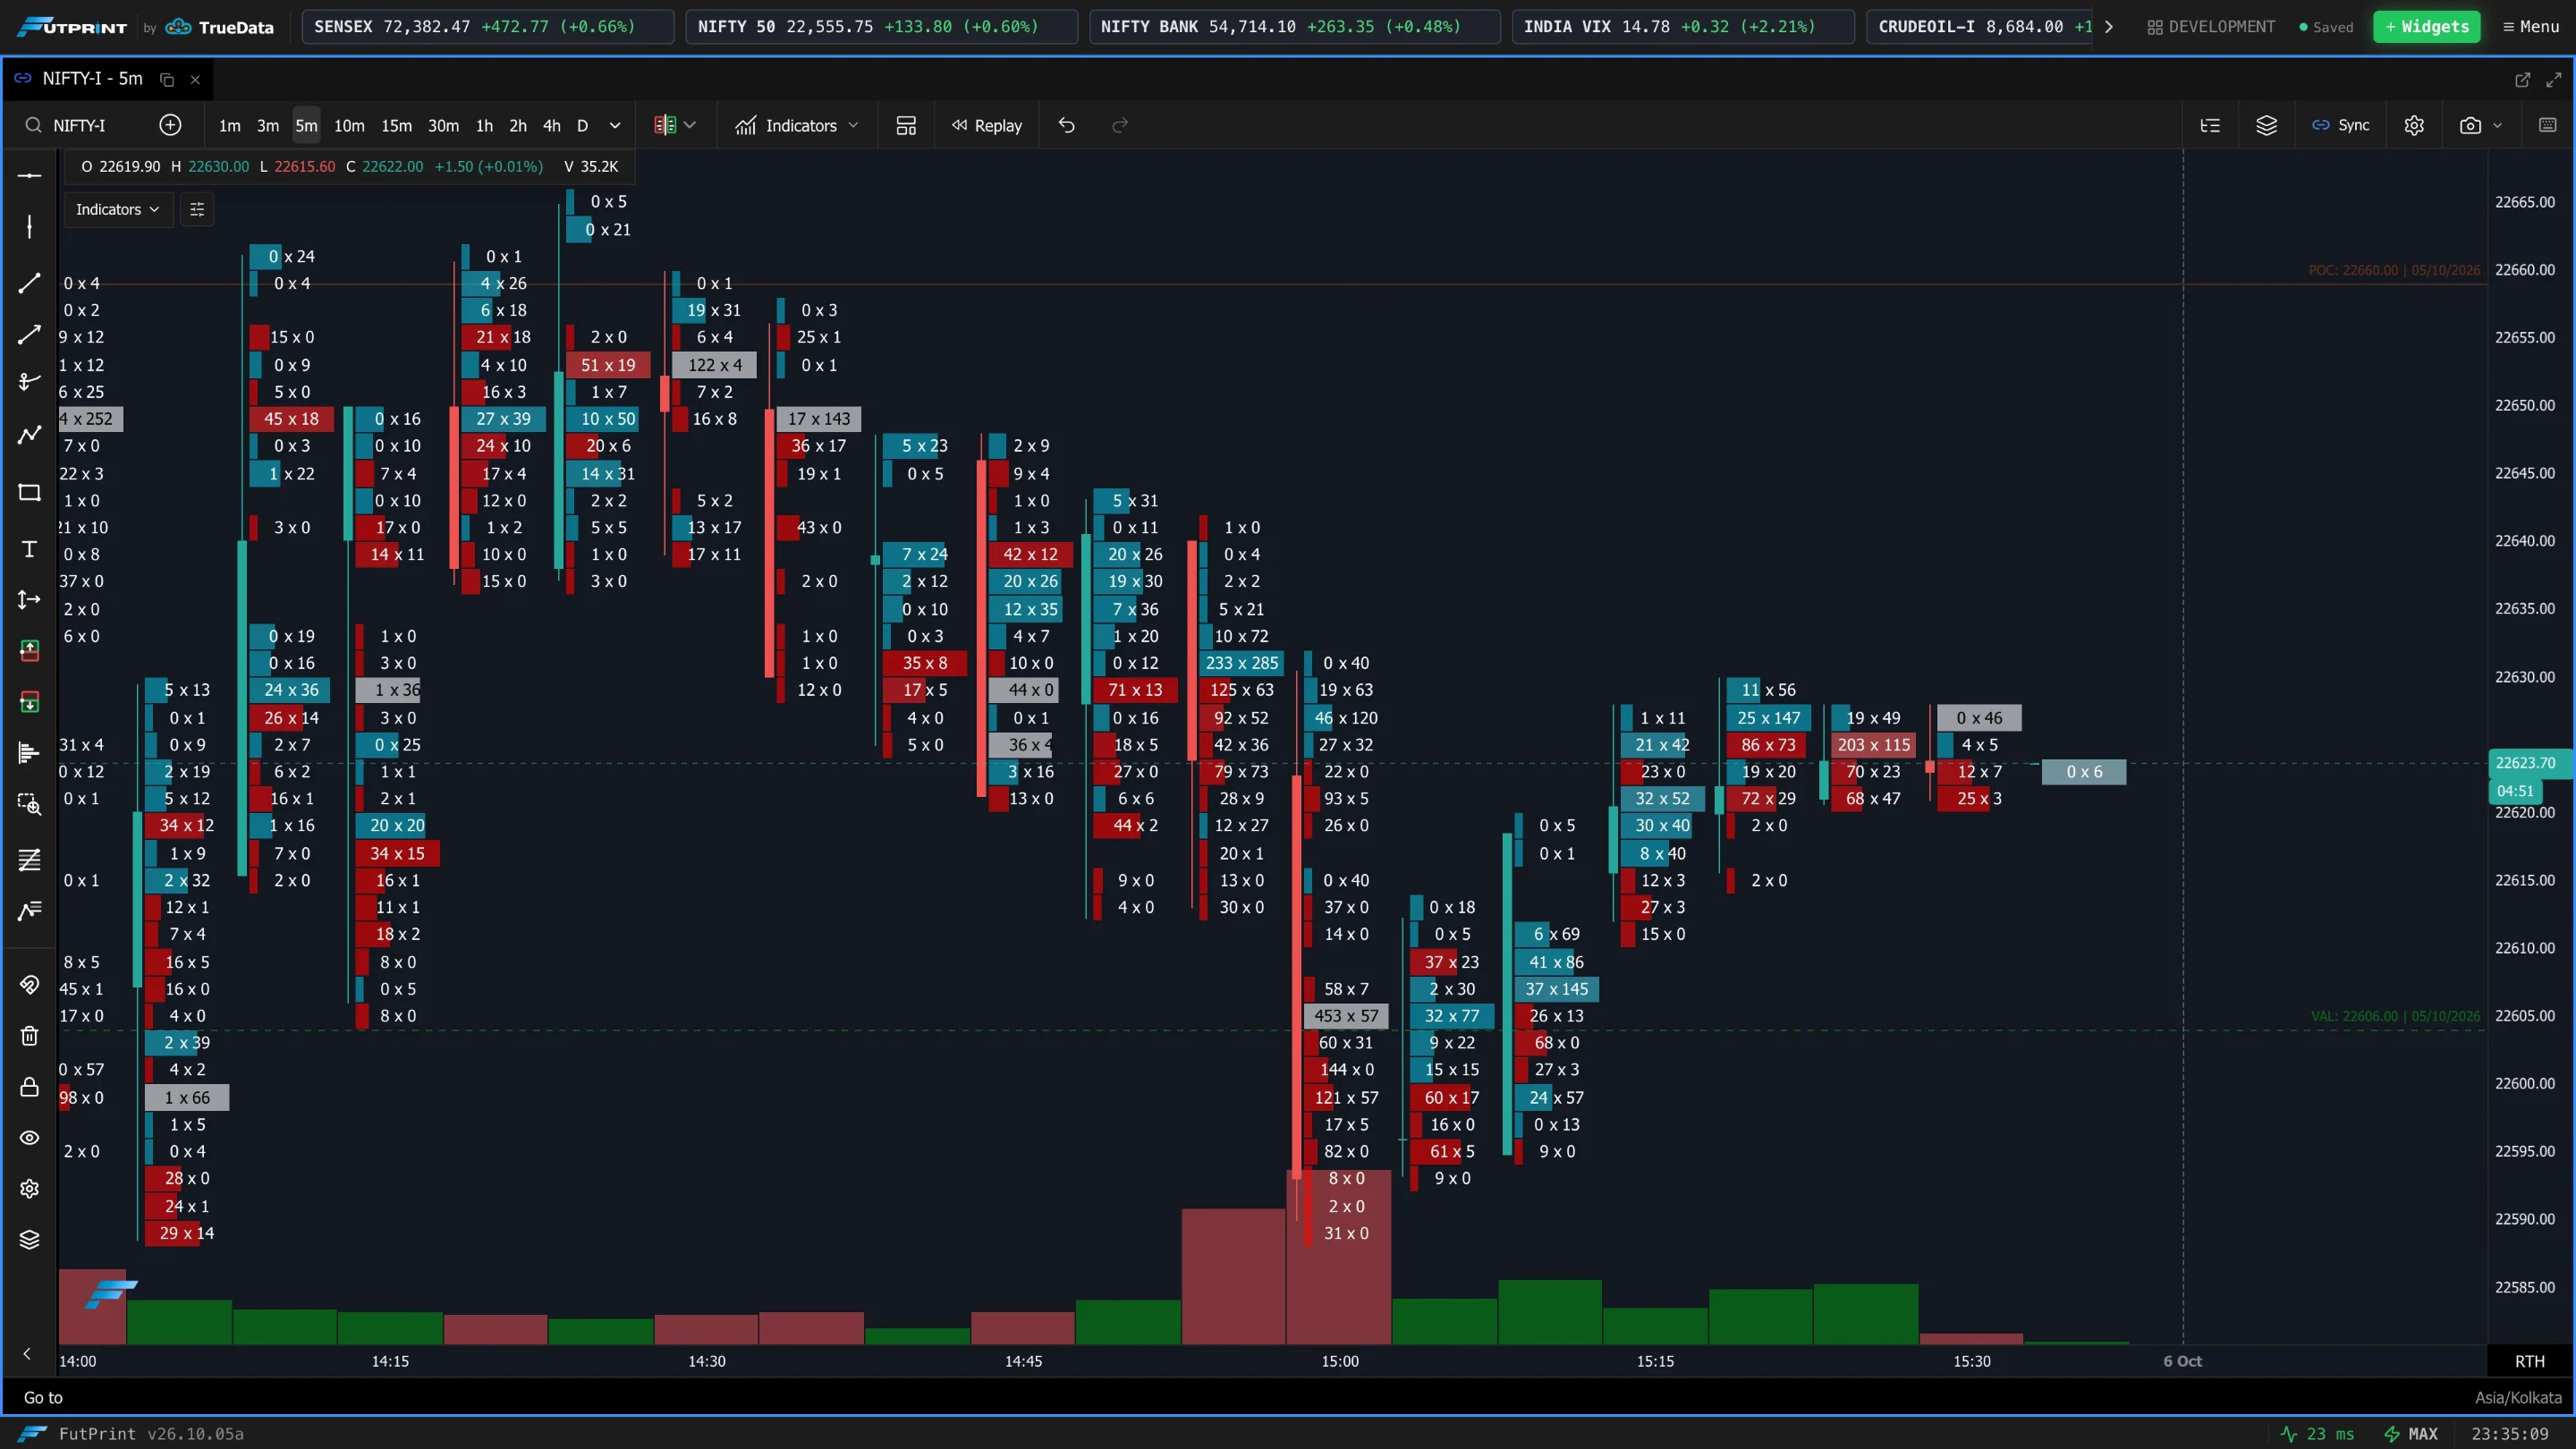
How opacity maps to volume:
- Smooth — opacity scales continuously with volume.
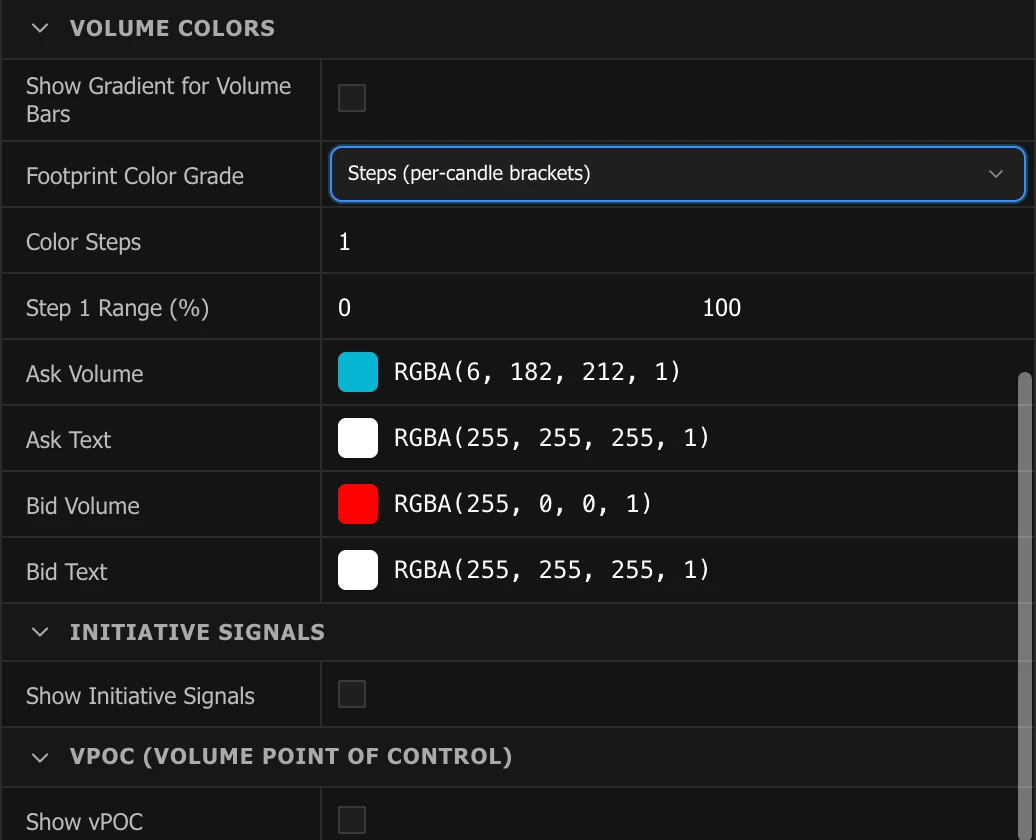
- Steps (per-candle brackets) — volume is grouped into discrete brackets, each bracket a percentage of that candle's total volume.
Color Steps
(shown when grade = Steps) The number of volume brackets per candle.
Step N Range (%)
(one per step) The percentage-of-candle-volume range each bracket covers. Set a step's Max to 100 for an open-ended top bracket.
Per-data-type colours
Below the grade controls, each active data type exposes its bar colour and text colour (the labels adapt to the chosen data type, e.g. buy/sell/delta). Use these to make the metric you care about pop.
Initiative Signals
| Setting | What it does |
|---|---|
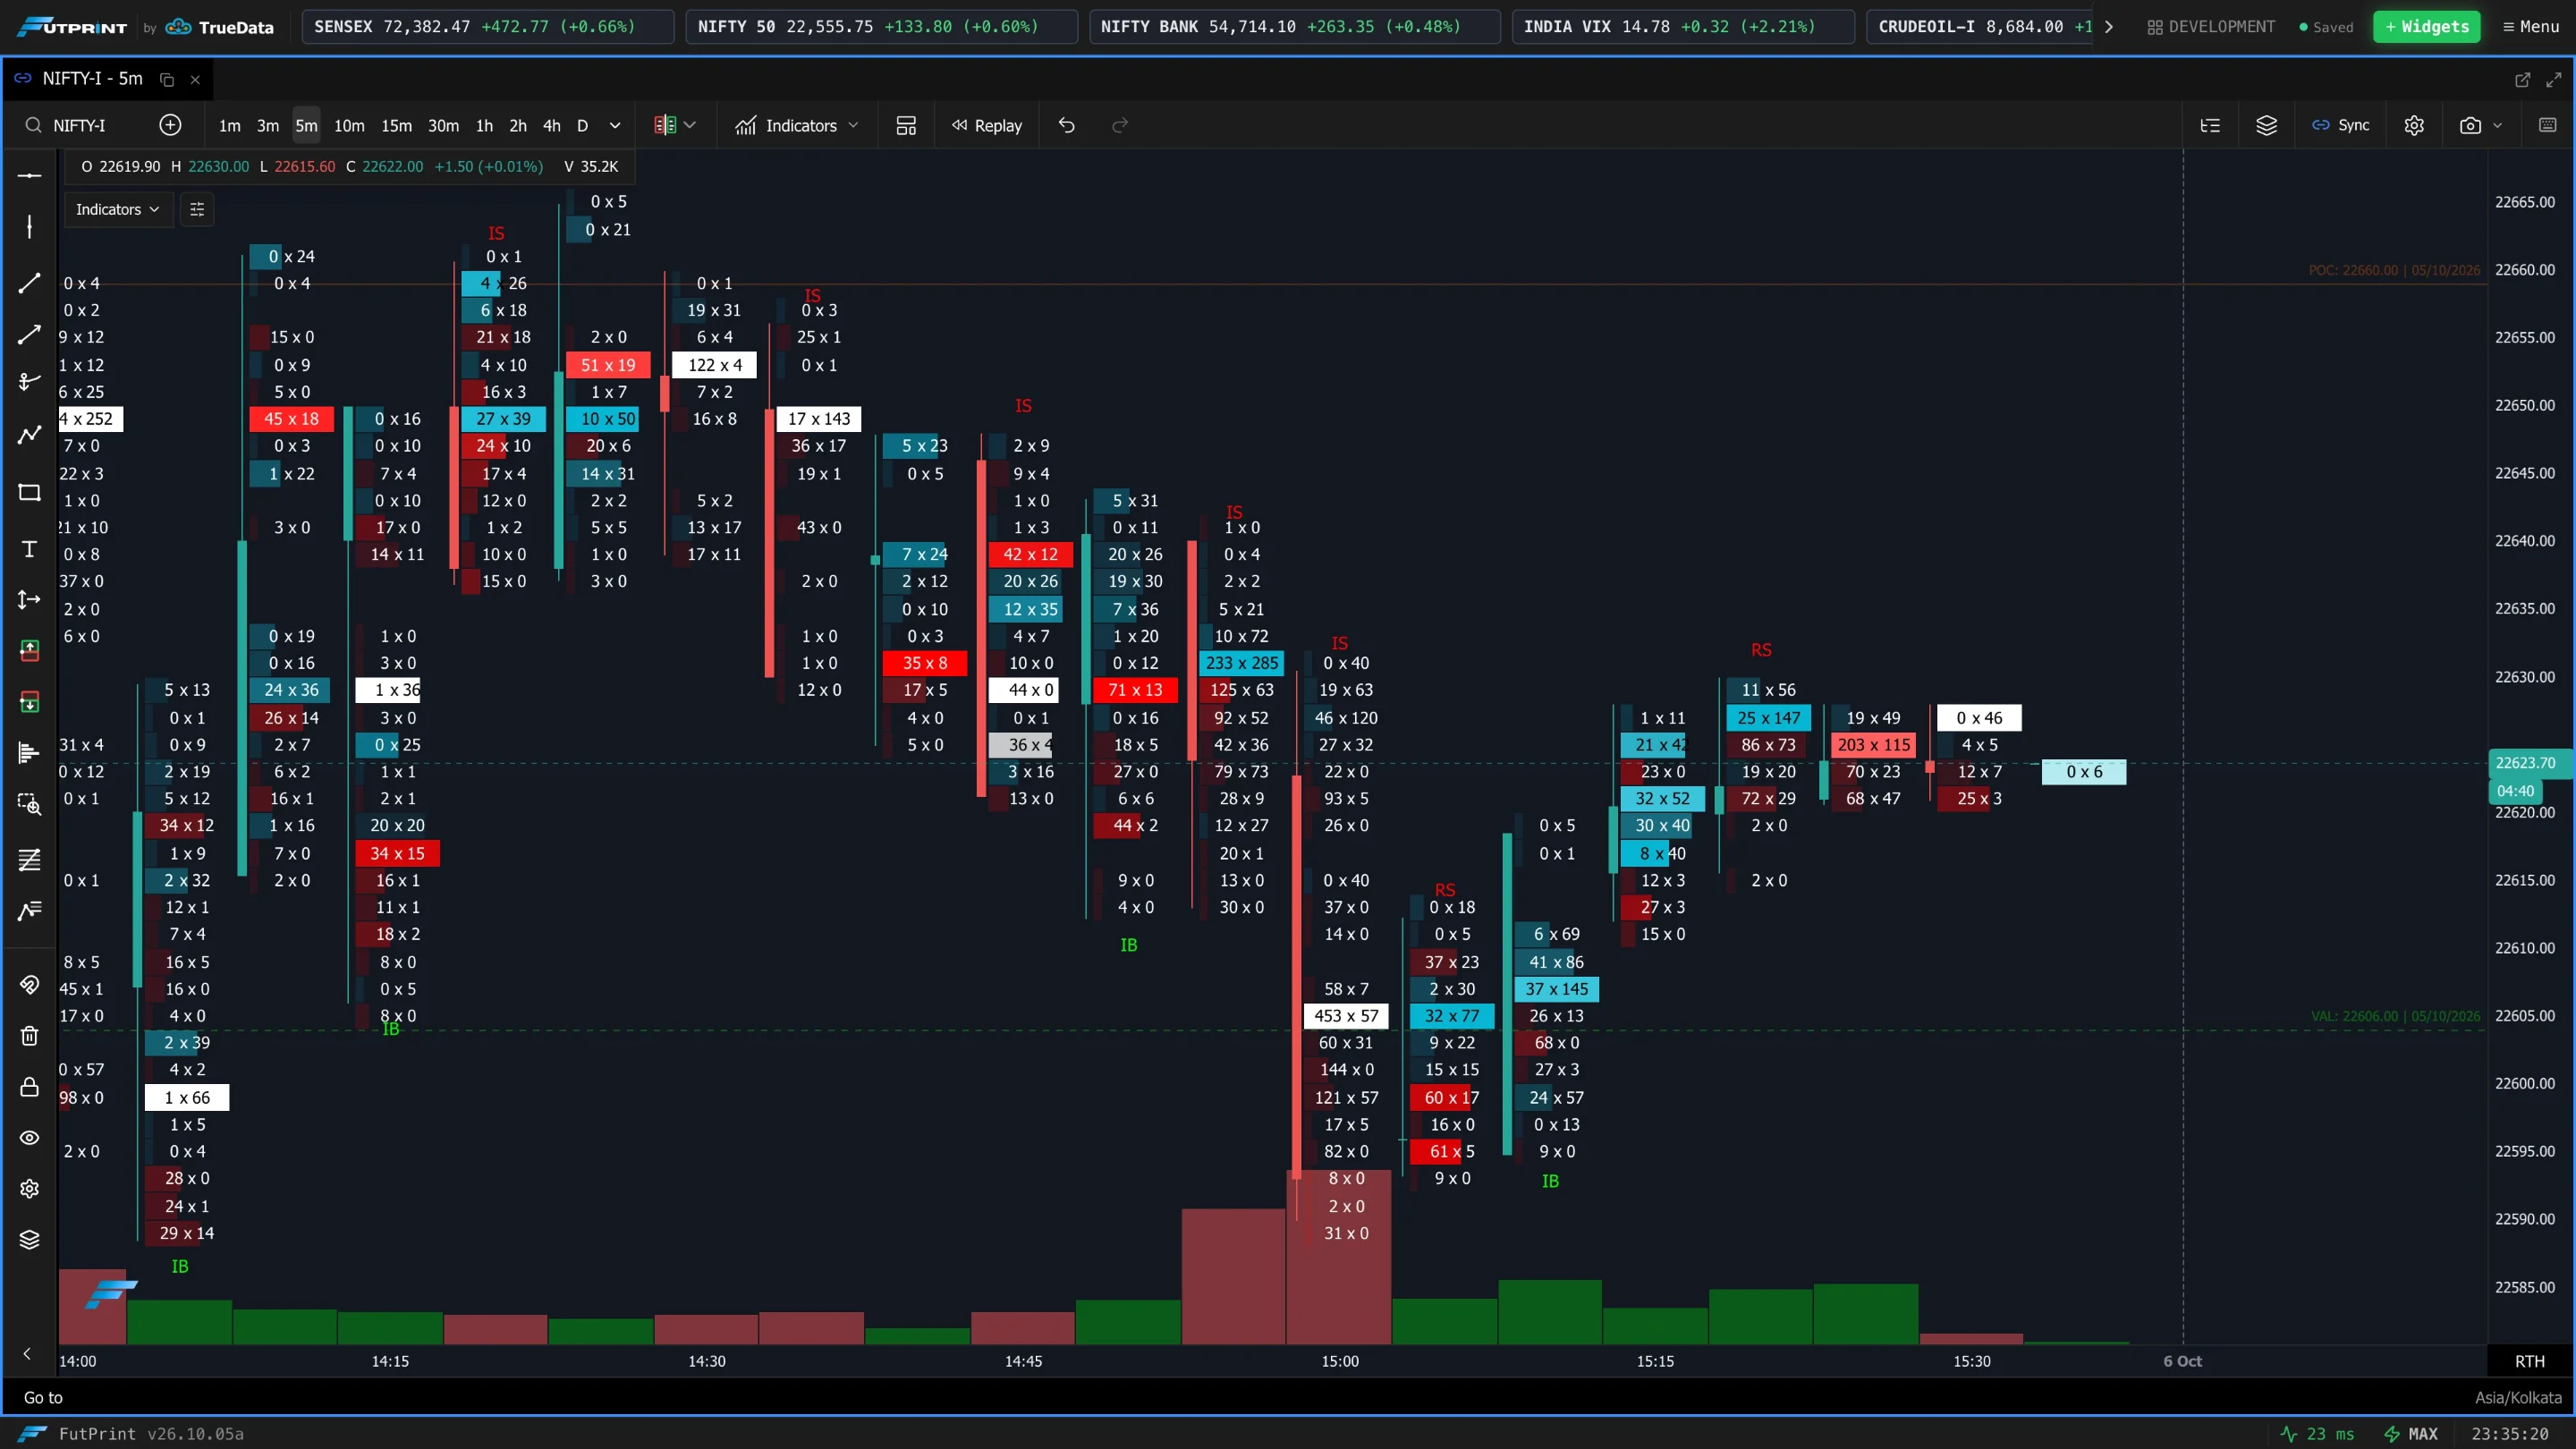
| Show Initiative Signals | Marks which side (buyers or sellers) is taking control at each price level — useful for reading momentum and possible turning points. |
vPOC (Volume Point of Control)
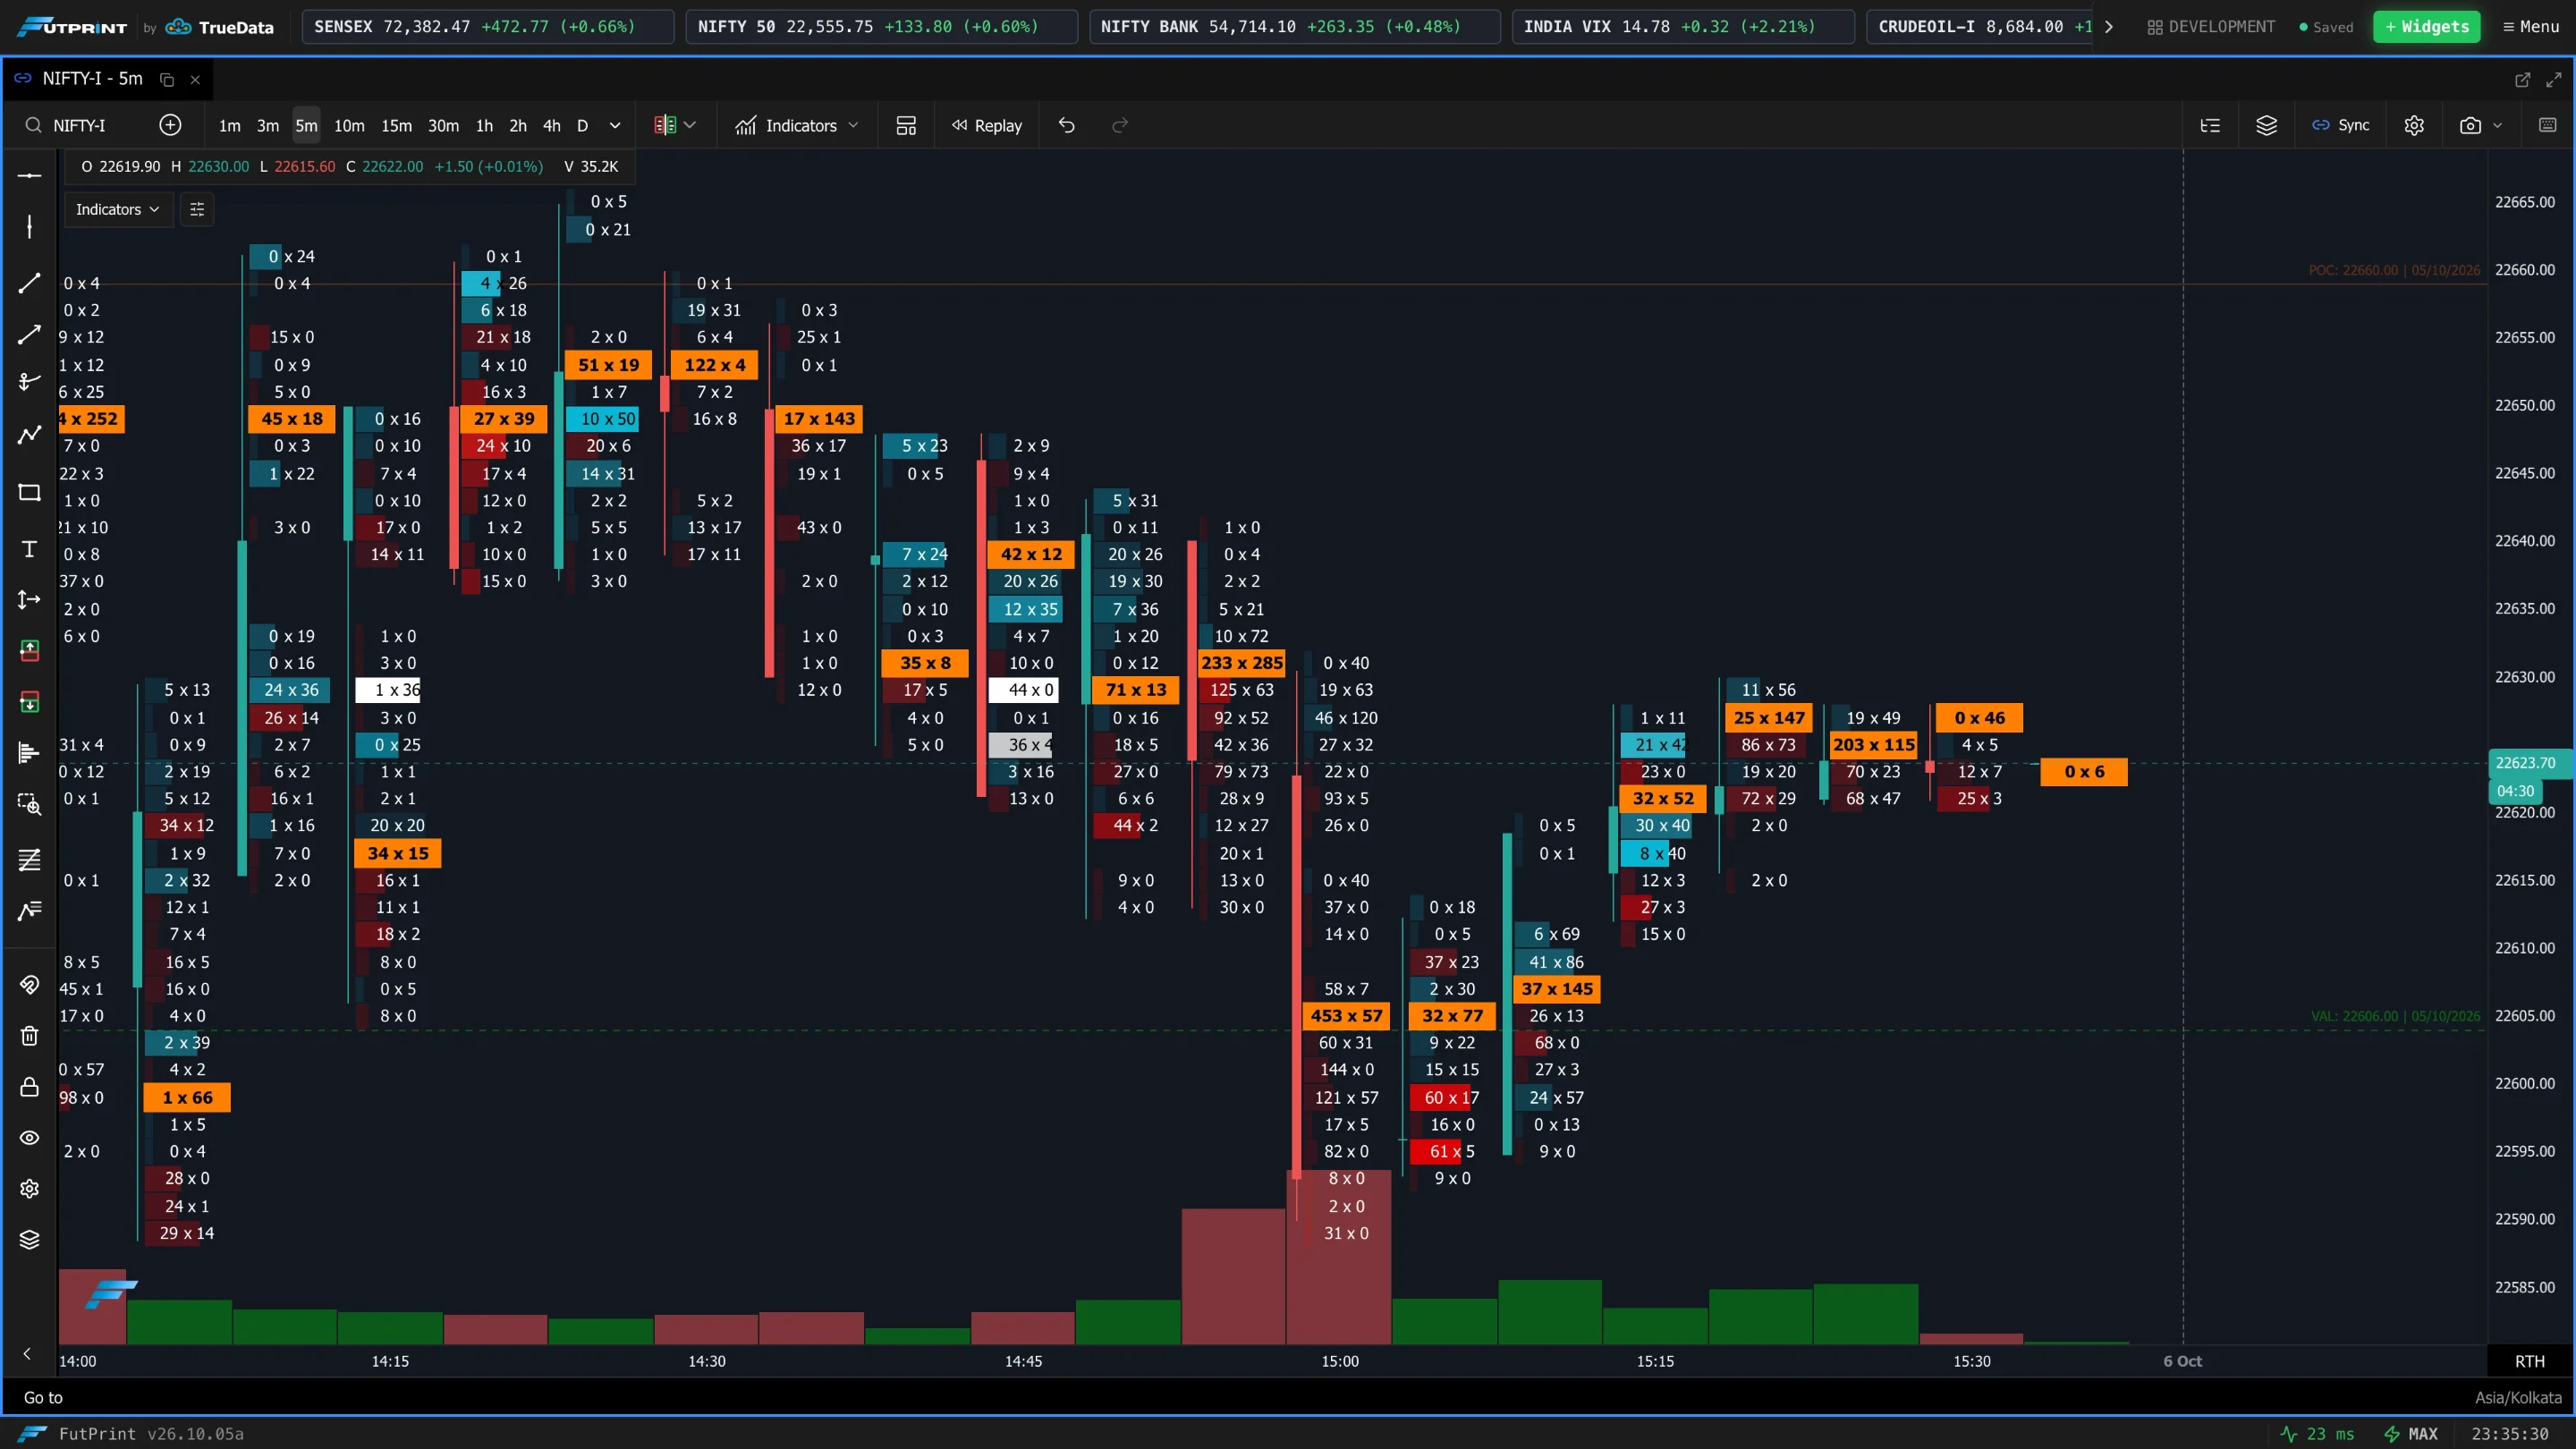
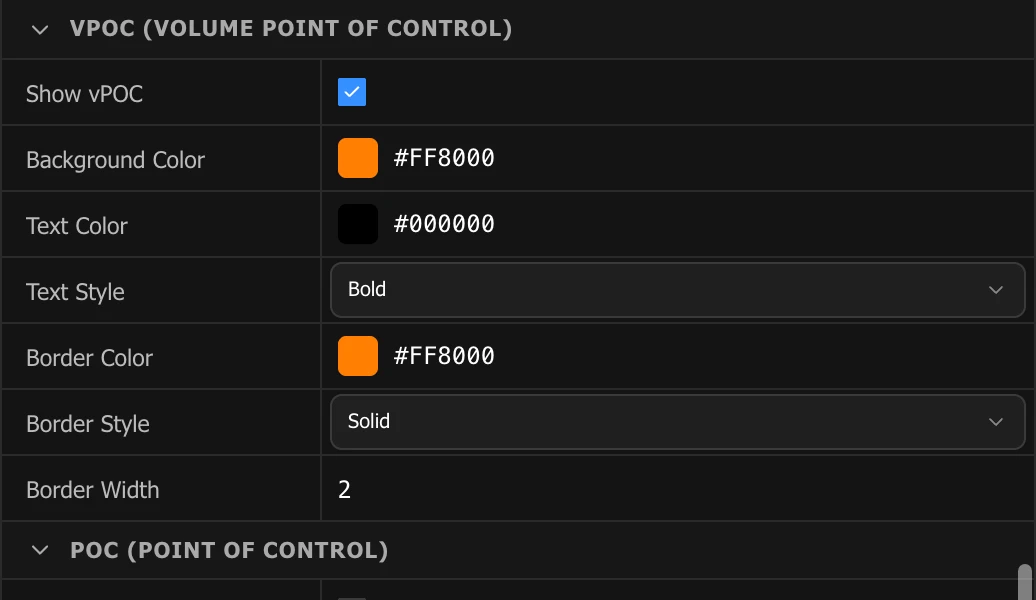
The vPOC is the single price level in a candle with the highest total traded volume — the "fairest" price, and a common support/resistance reference.
| Setting | What it does |
|---|---|
| Show vPOC | Draw the vPOC for each candle (based on maximum total volume). |
| Background Color | Fill colour of the vPOC level. |
| Text Color | Colour of the volume text on the vPOC level. |
| Text Style | Normal or Bold. |
| Border Color | Outline colour of the vPOC level. |
| Border Style | Solid, Dashed or Dotted. |
| Border Width | Outline thickness. |
POC (Point of Control)
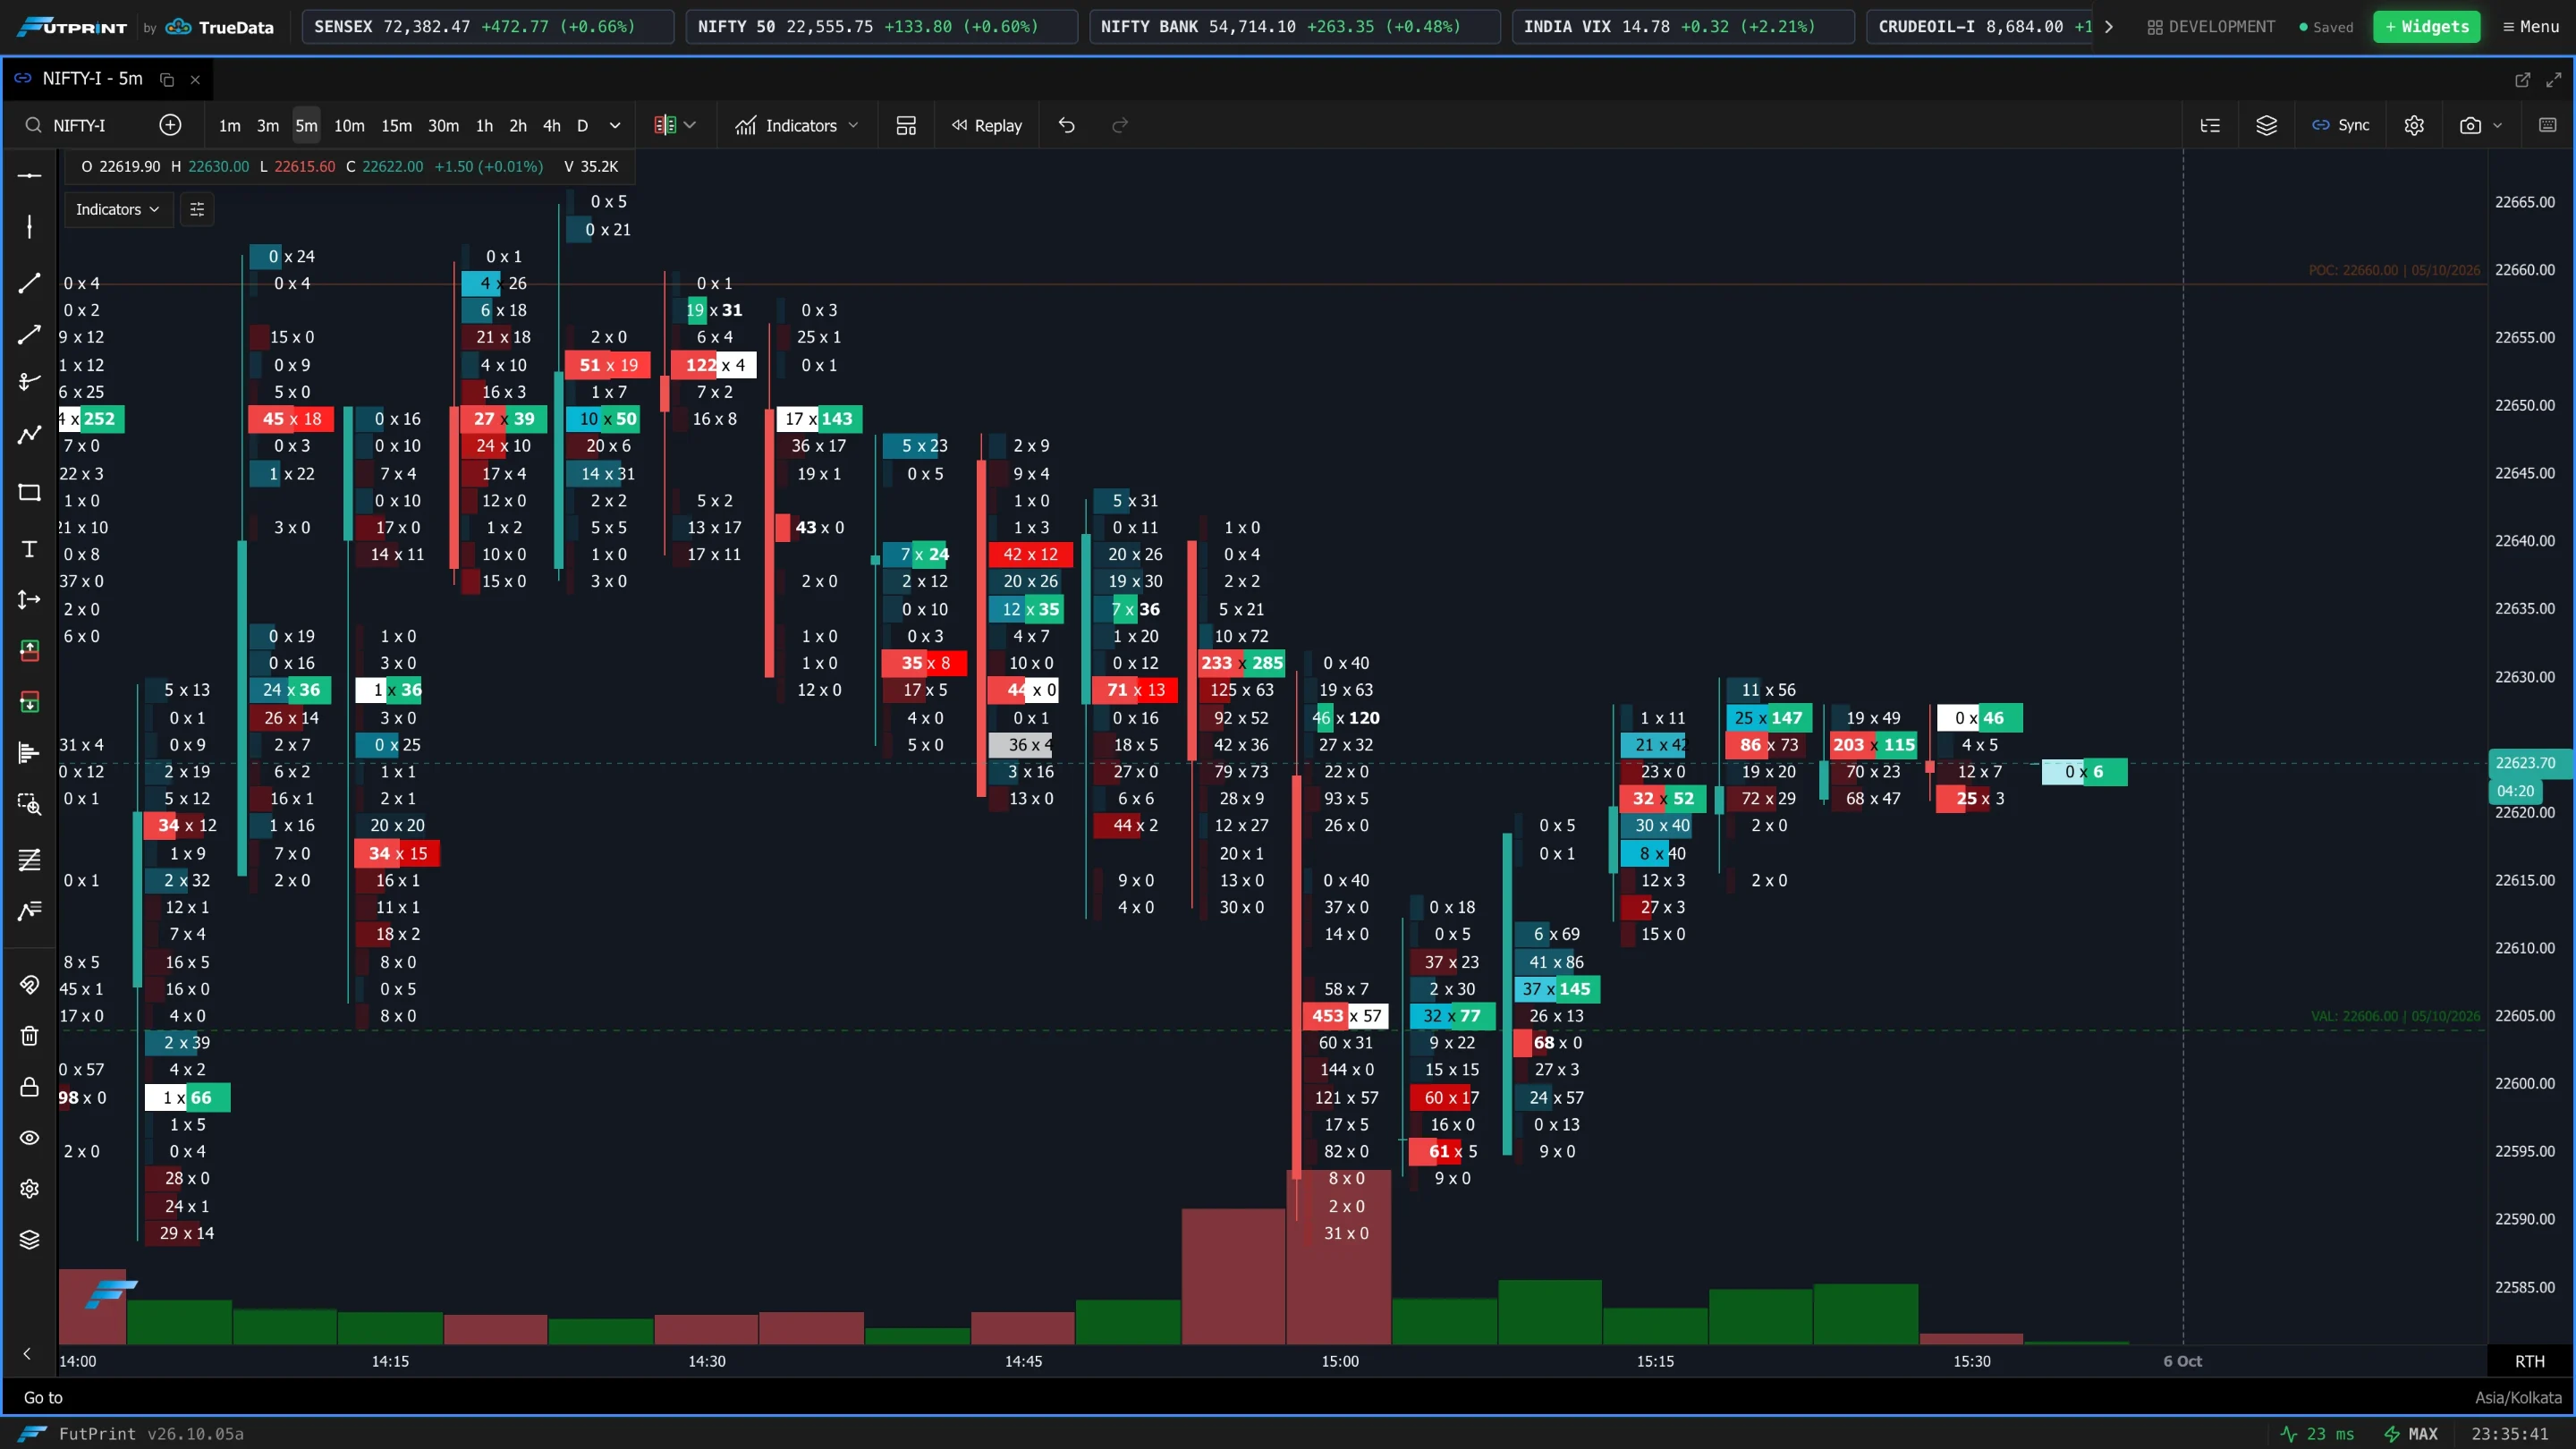
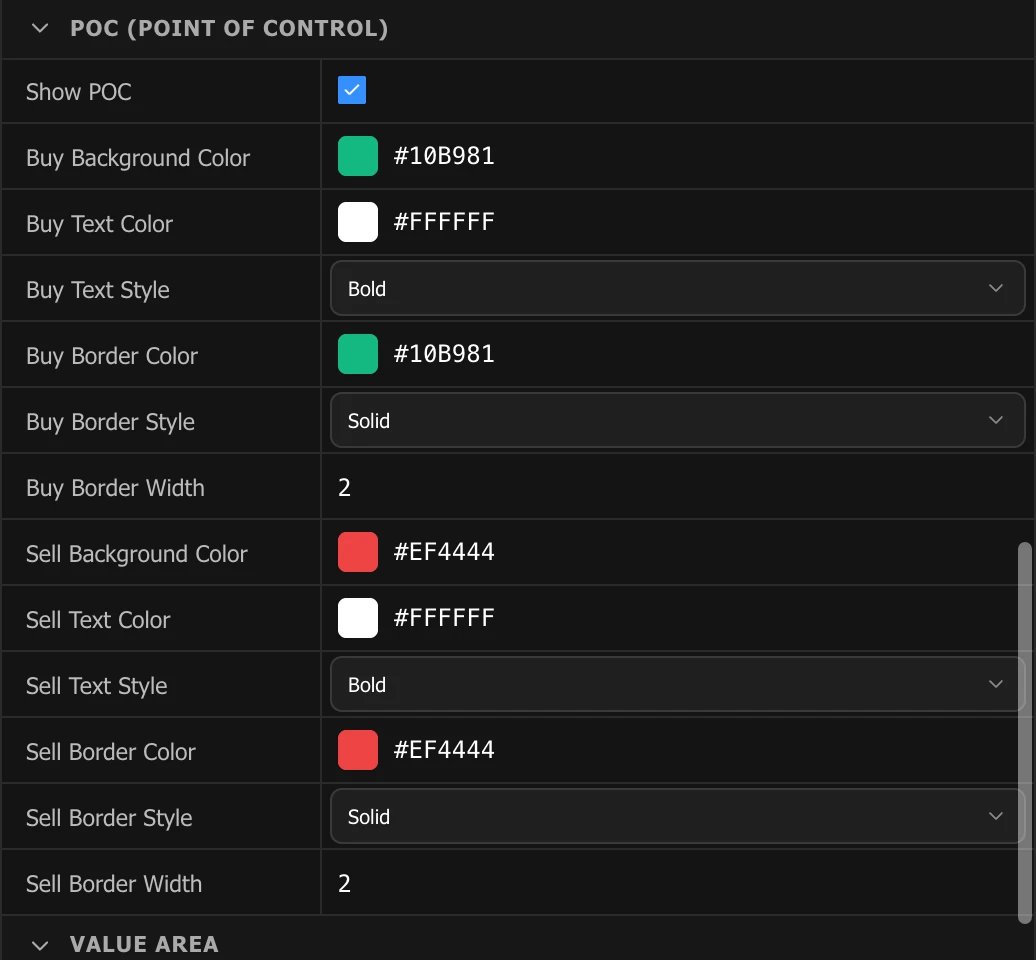
Unlike vPOC (which is always total volume), POC highlights the level with the highest value of the selected data type, per side — so you can find the point of control for buys, sells, delta, trades, etc., separately.
| Setting | What it does |
|---|---|
| Show POC | Draw the per-side POC based on the selected data type. |
| Buy Background / Text / Border Color | Colours for the buy-side POC level. |
| Buy Text Style | Normal or Bold. |
| Buy Border Style / Width | Line style (Solid/Dashed/Dotted) and thickness. |
| Sell Background / Text / Border Color | Colours for the sell-side POC level. |
| Sell Text Style | Normal or Bold. |
| Sell Border Style / Width | Line style and thickness. |
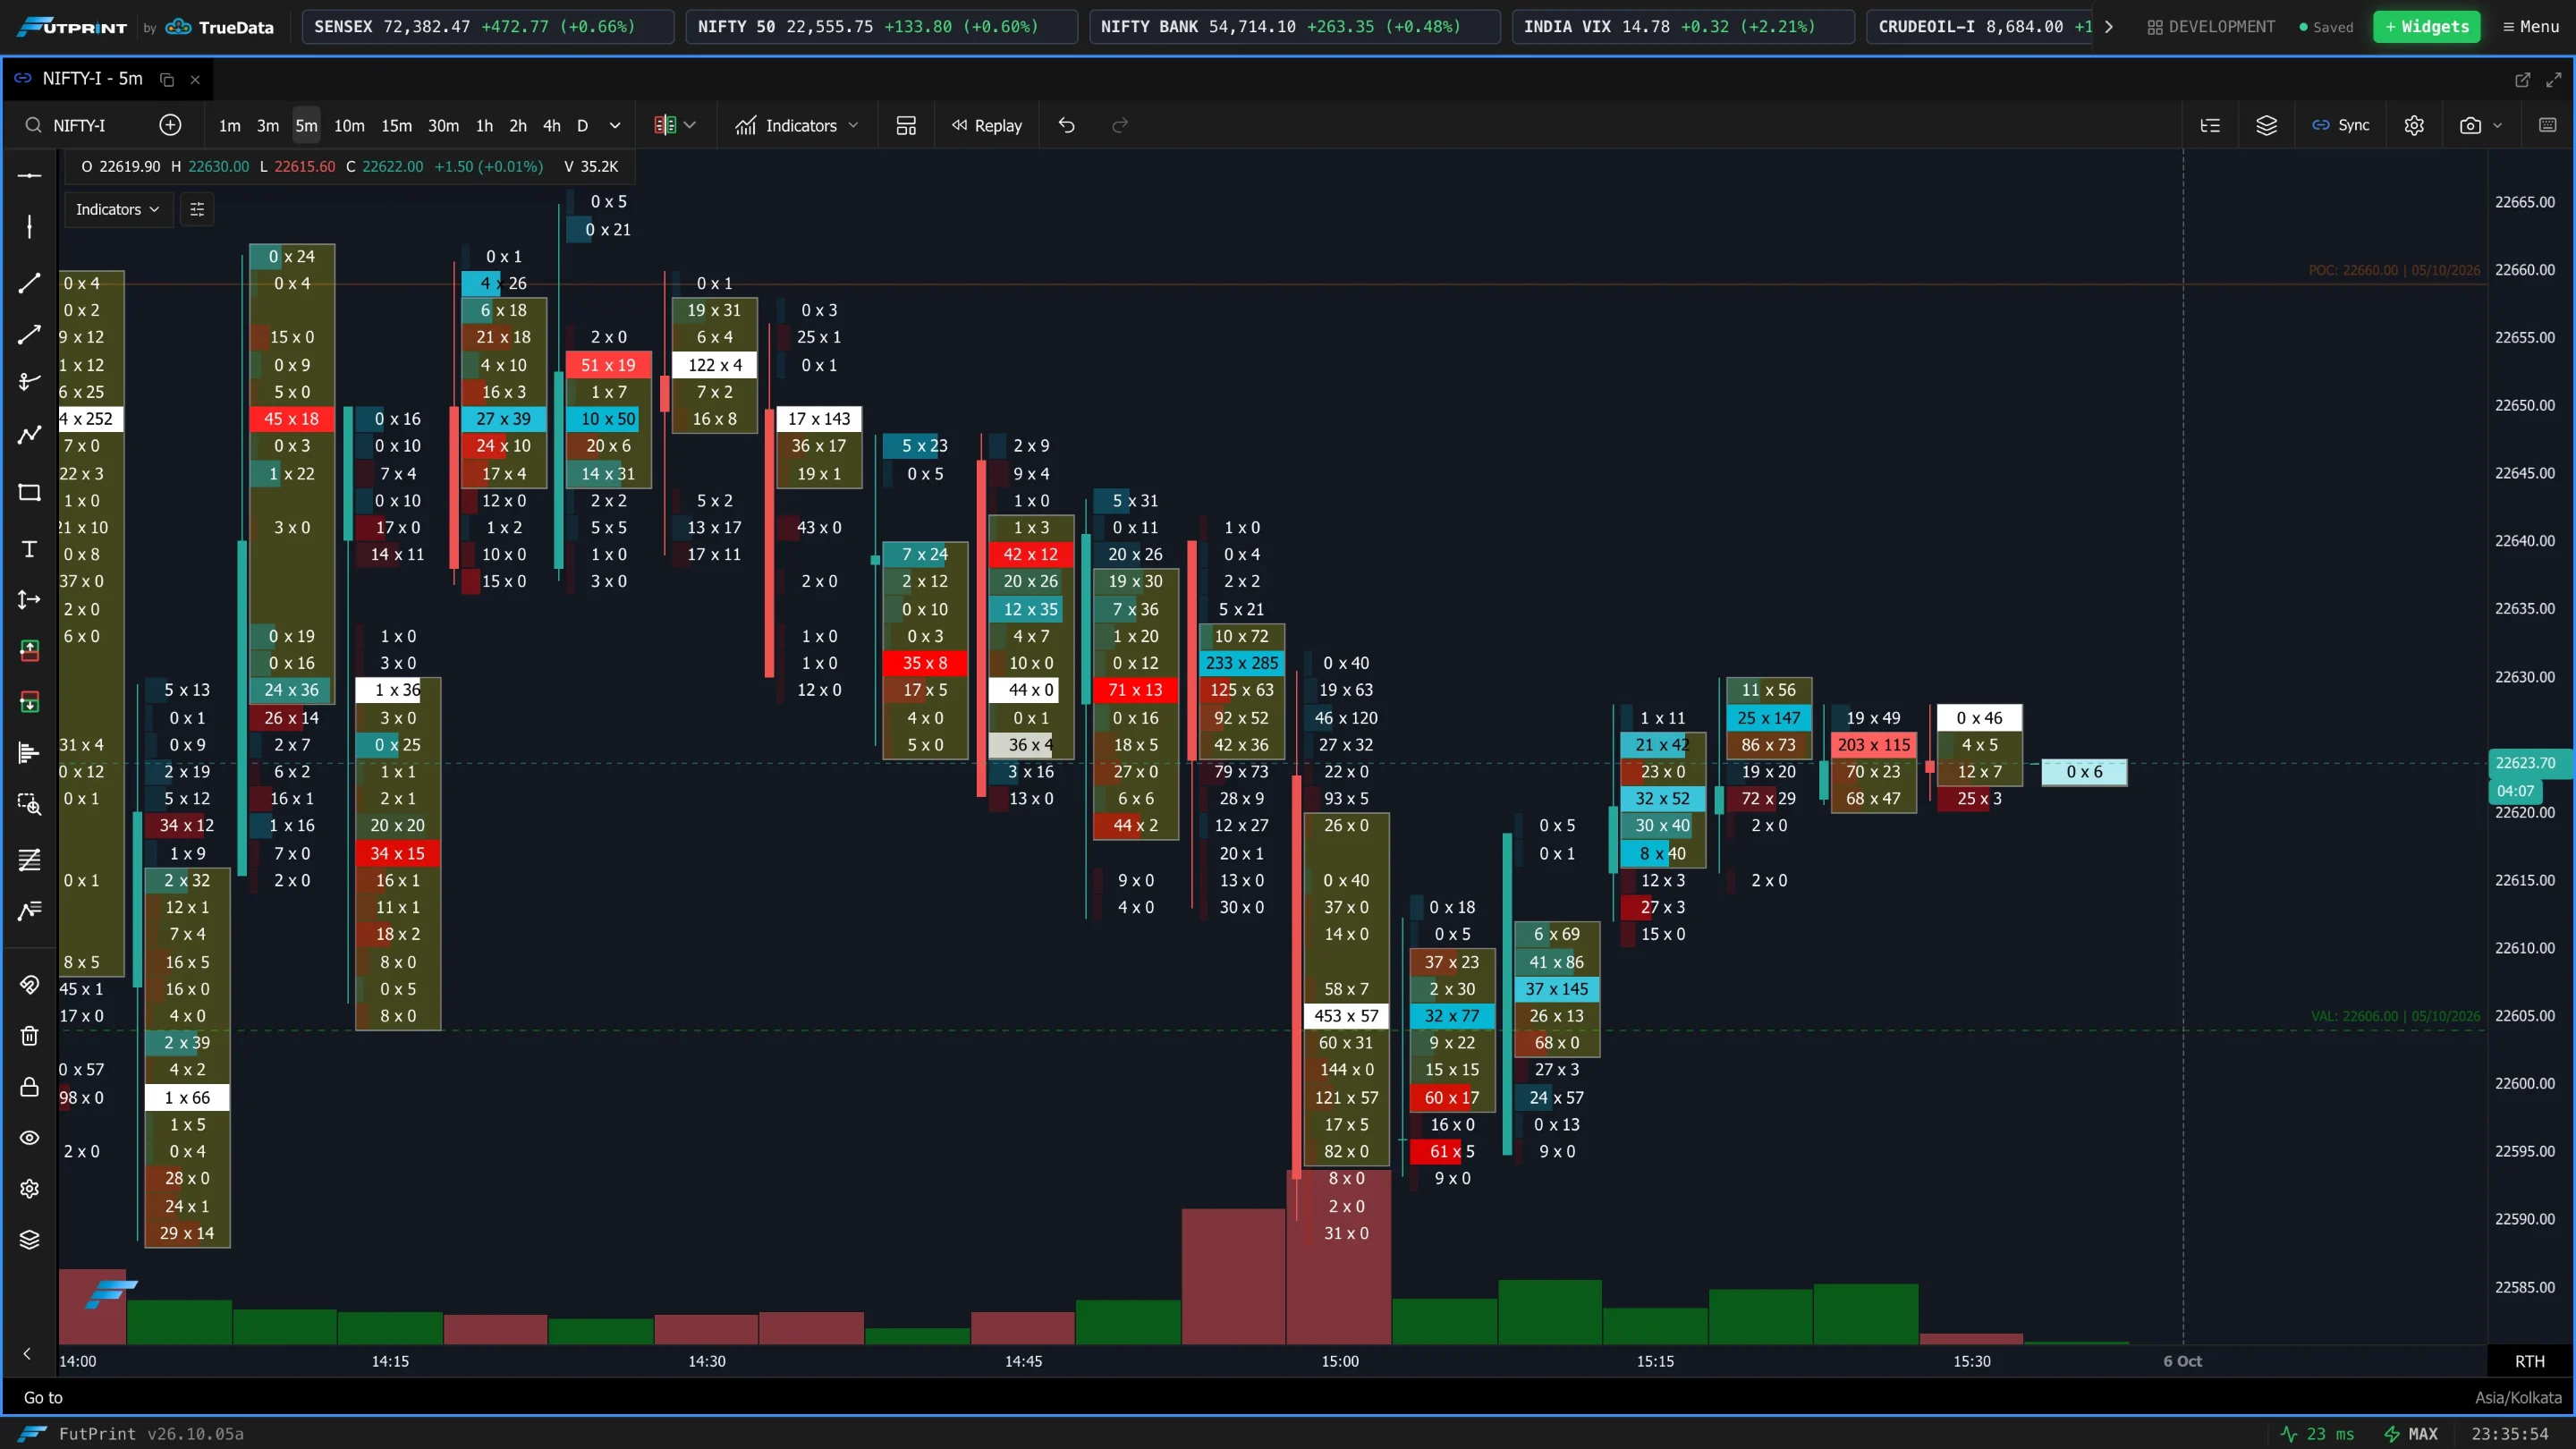
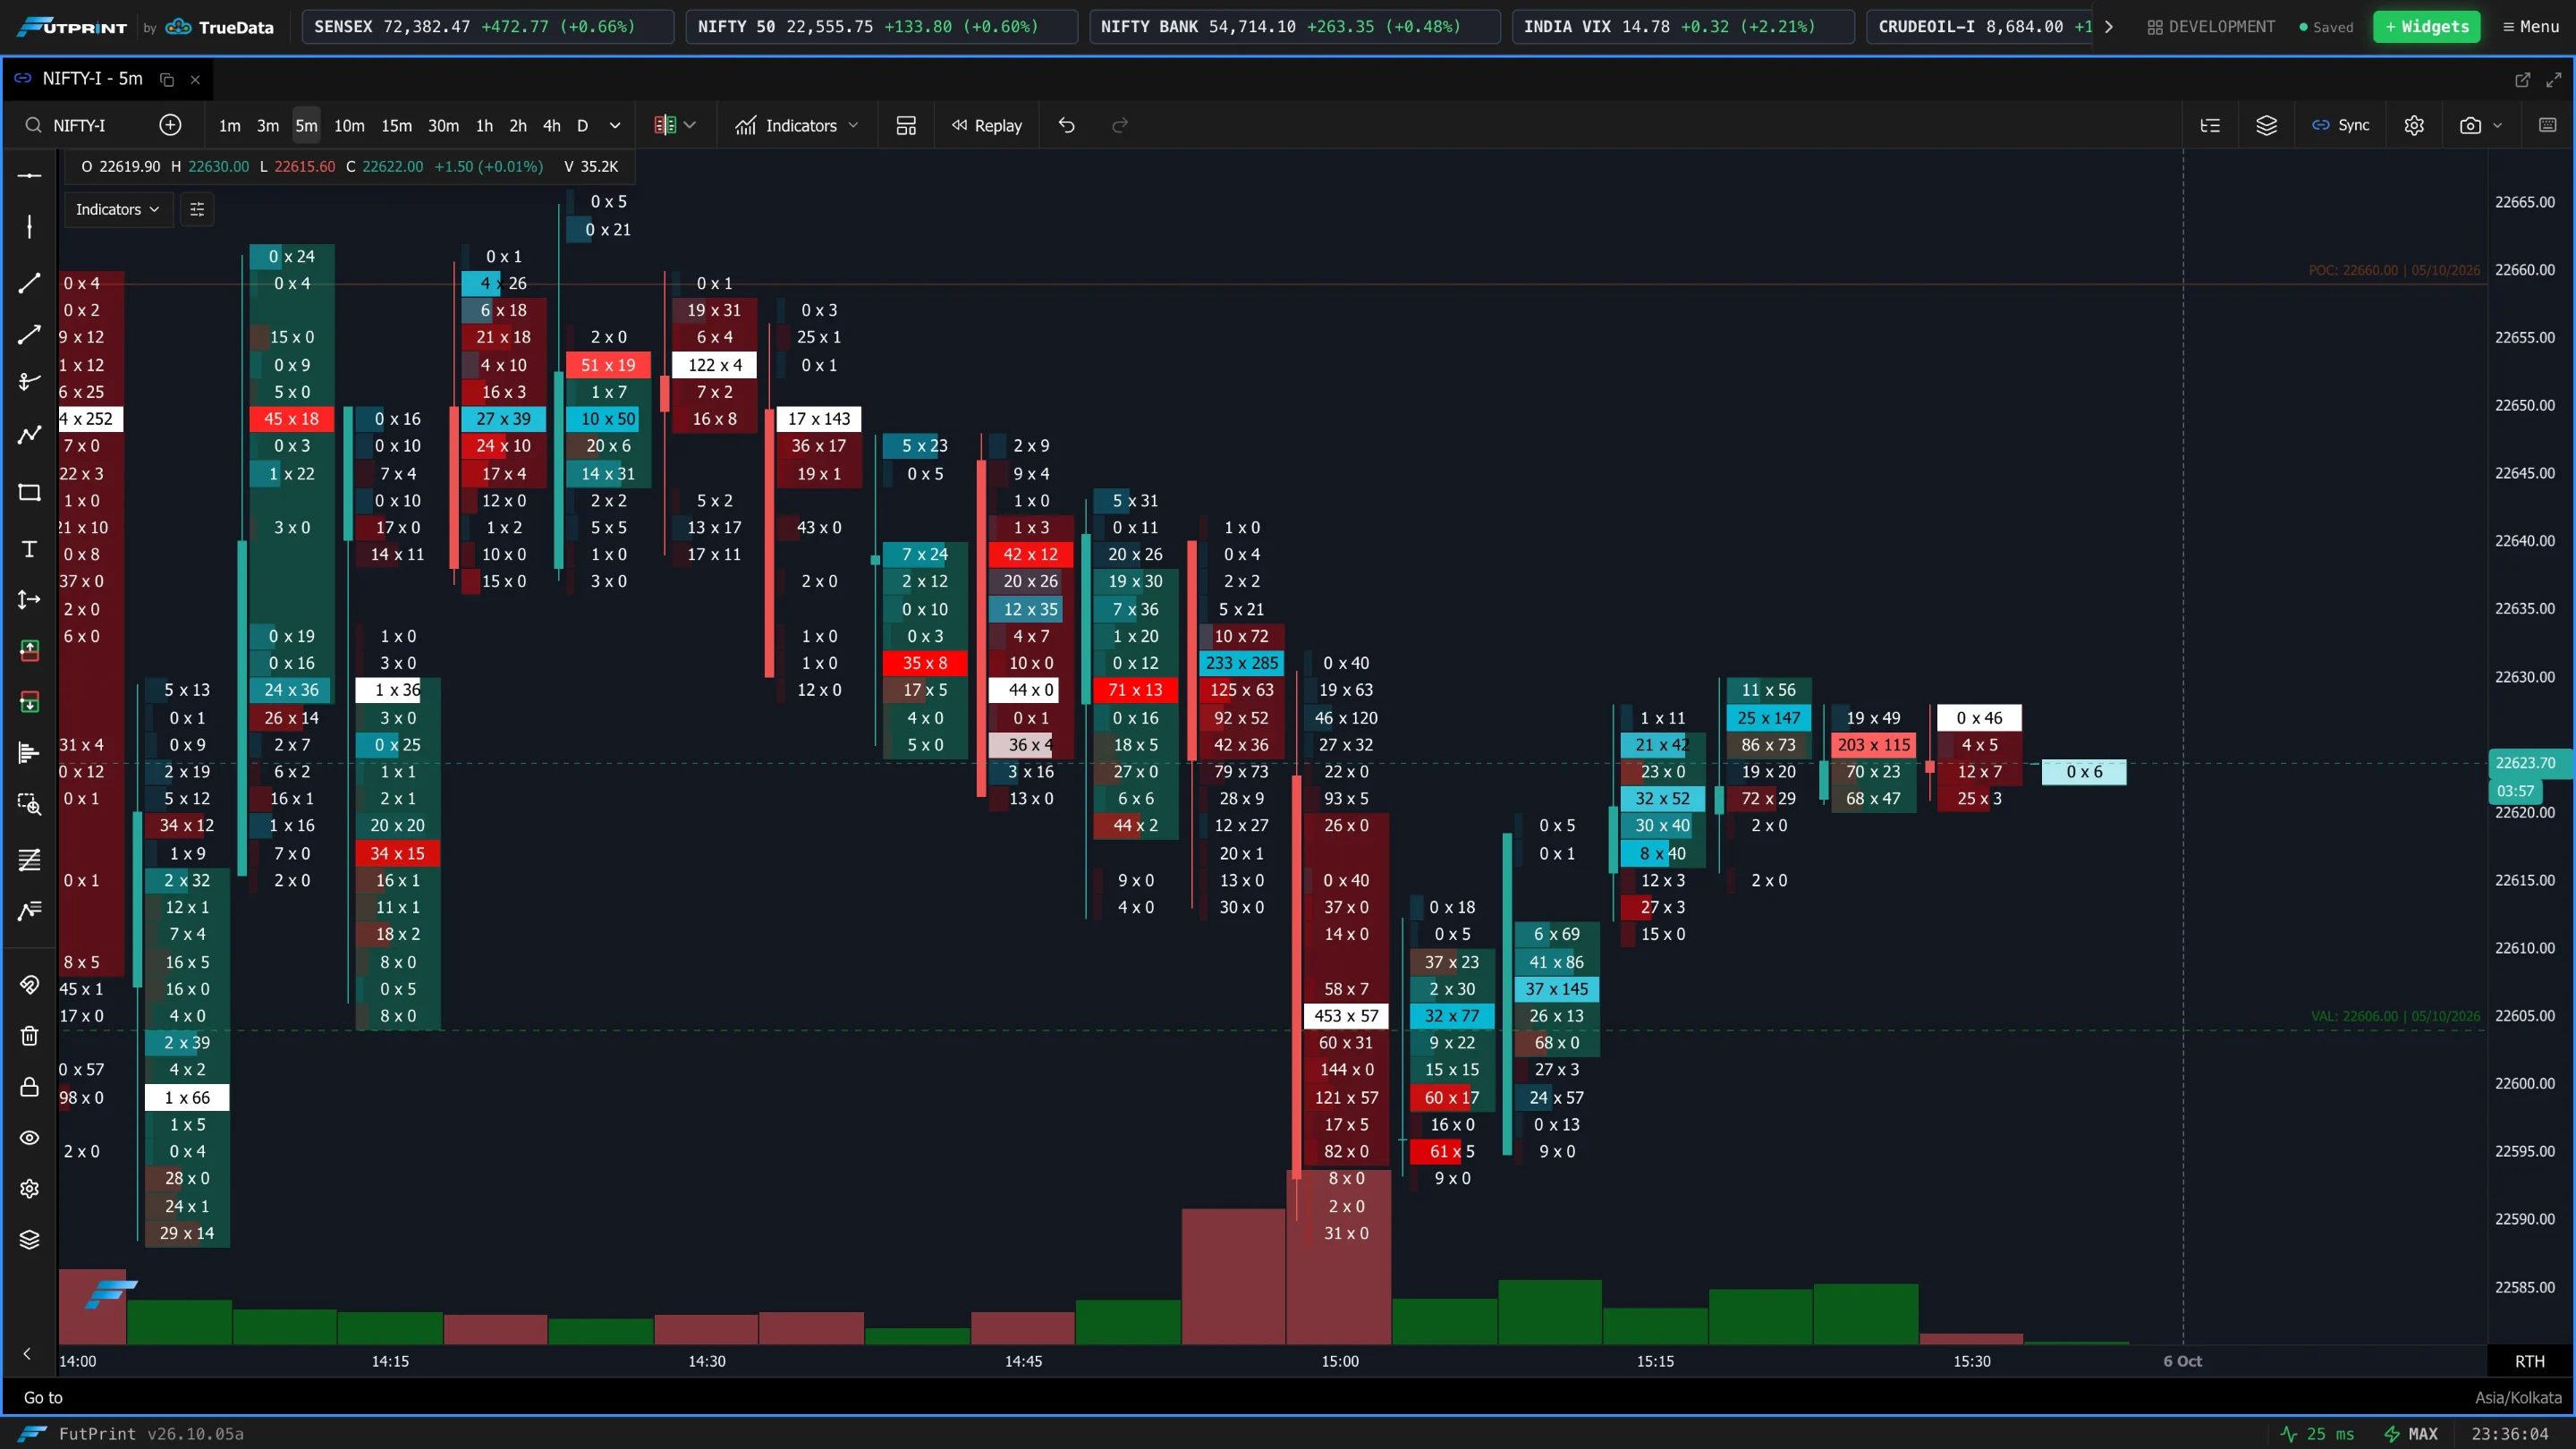
Value Area
The Value Area is the price range containing ~70% of the candle's volume — a core Market-Profile concept that frames where fair-value trading occurred and often acts as support/resistance.
| Setting | What it does |
|---|---|
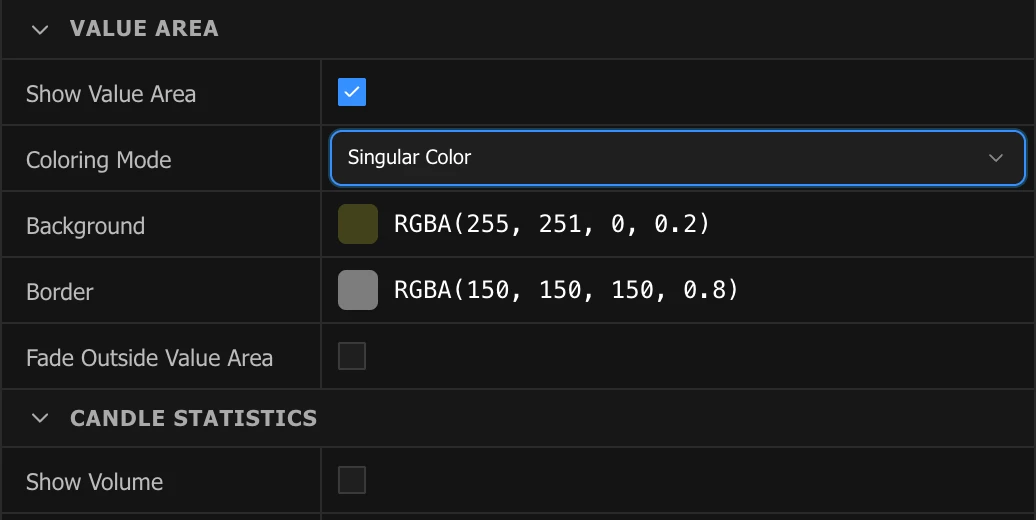
| Show Value Area | Highlight the value-area zone on each candle. |
| Coloring Mode | Singular Color (one colour always) or Candle-based Color (green when the candle is bullish, red when bearish). |
| Background / Border | (Singular mode) the value-area fill and outline colours. |
| Bullish Background / Bullish Border | (Candle-based mode) colours when the candle is up. |
| Bearish Background / Bearish Border | (Candle-based mode) colours when the candle is down. |
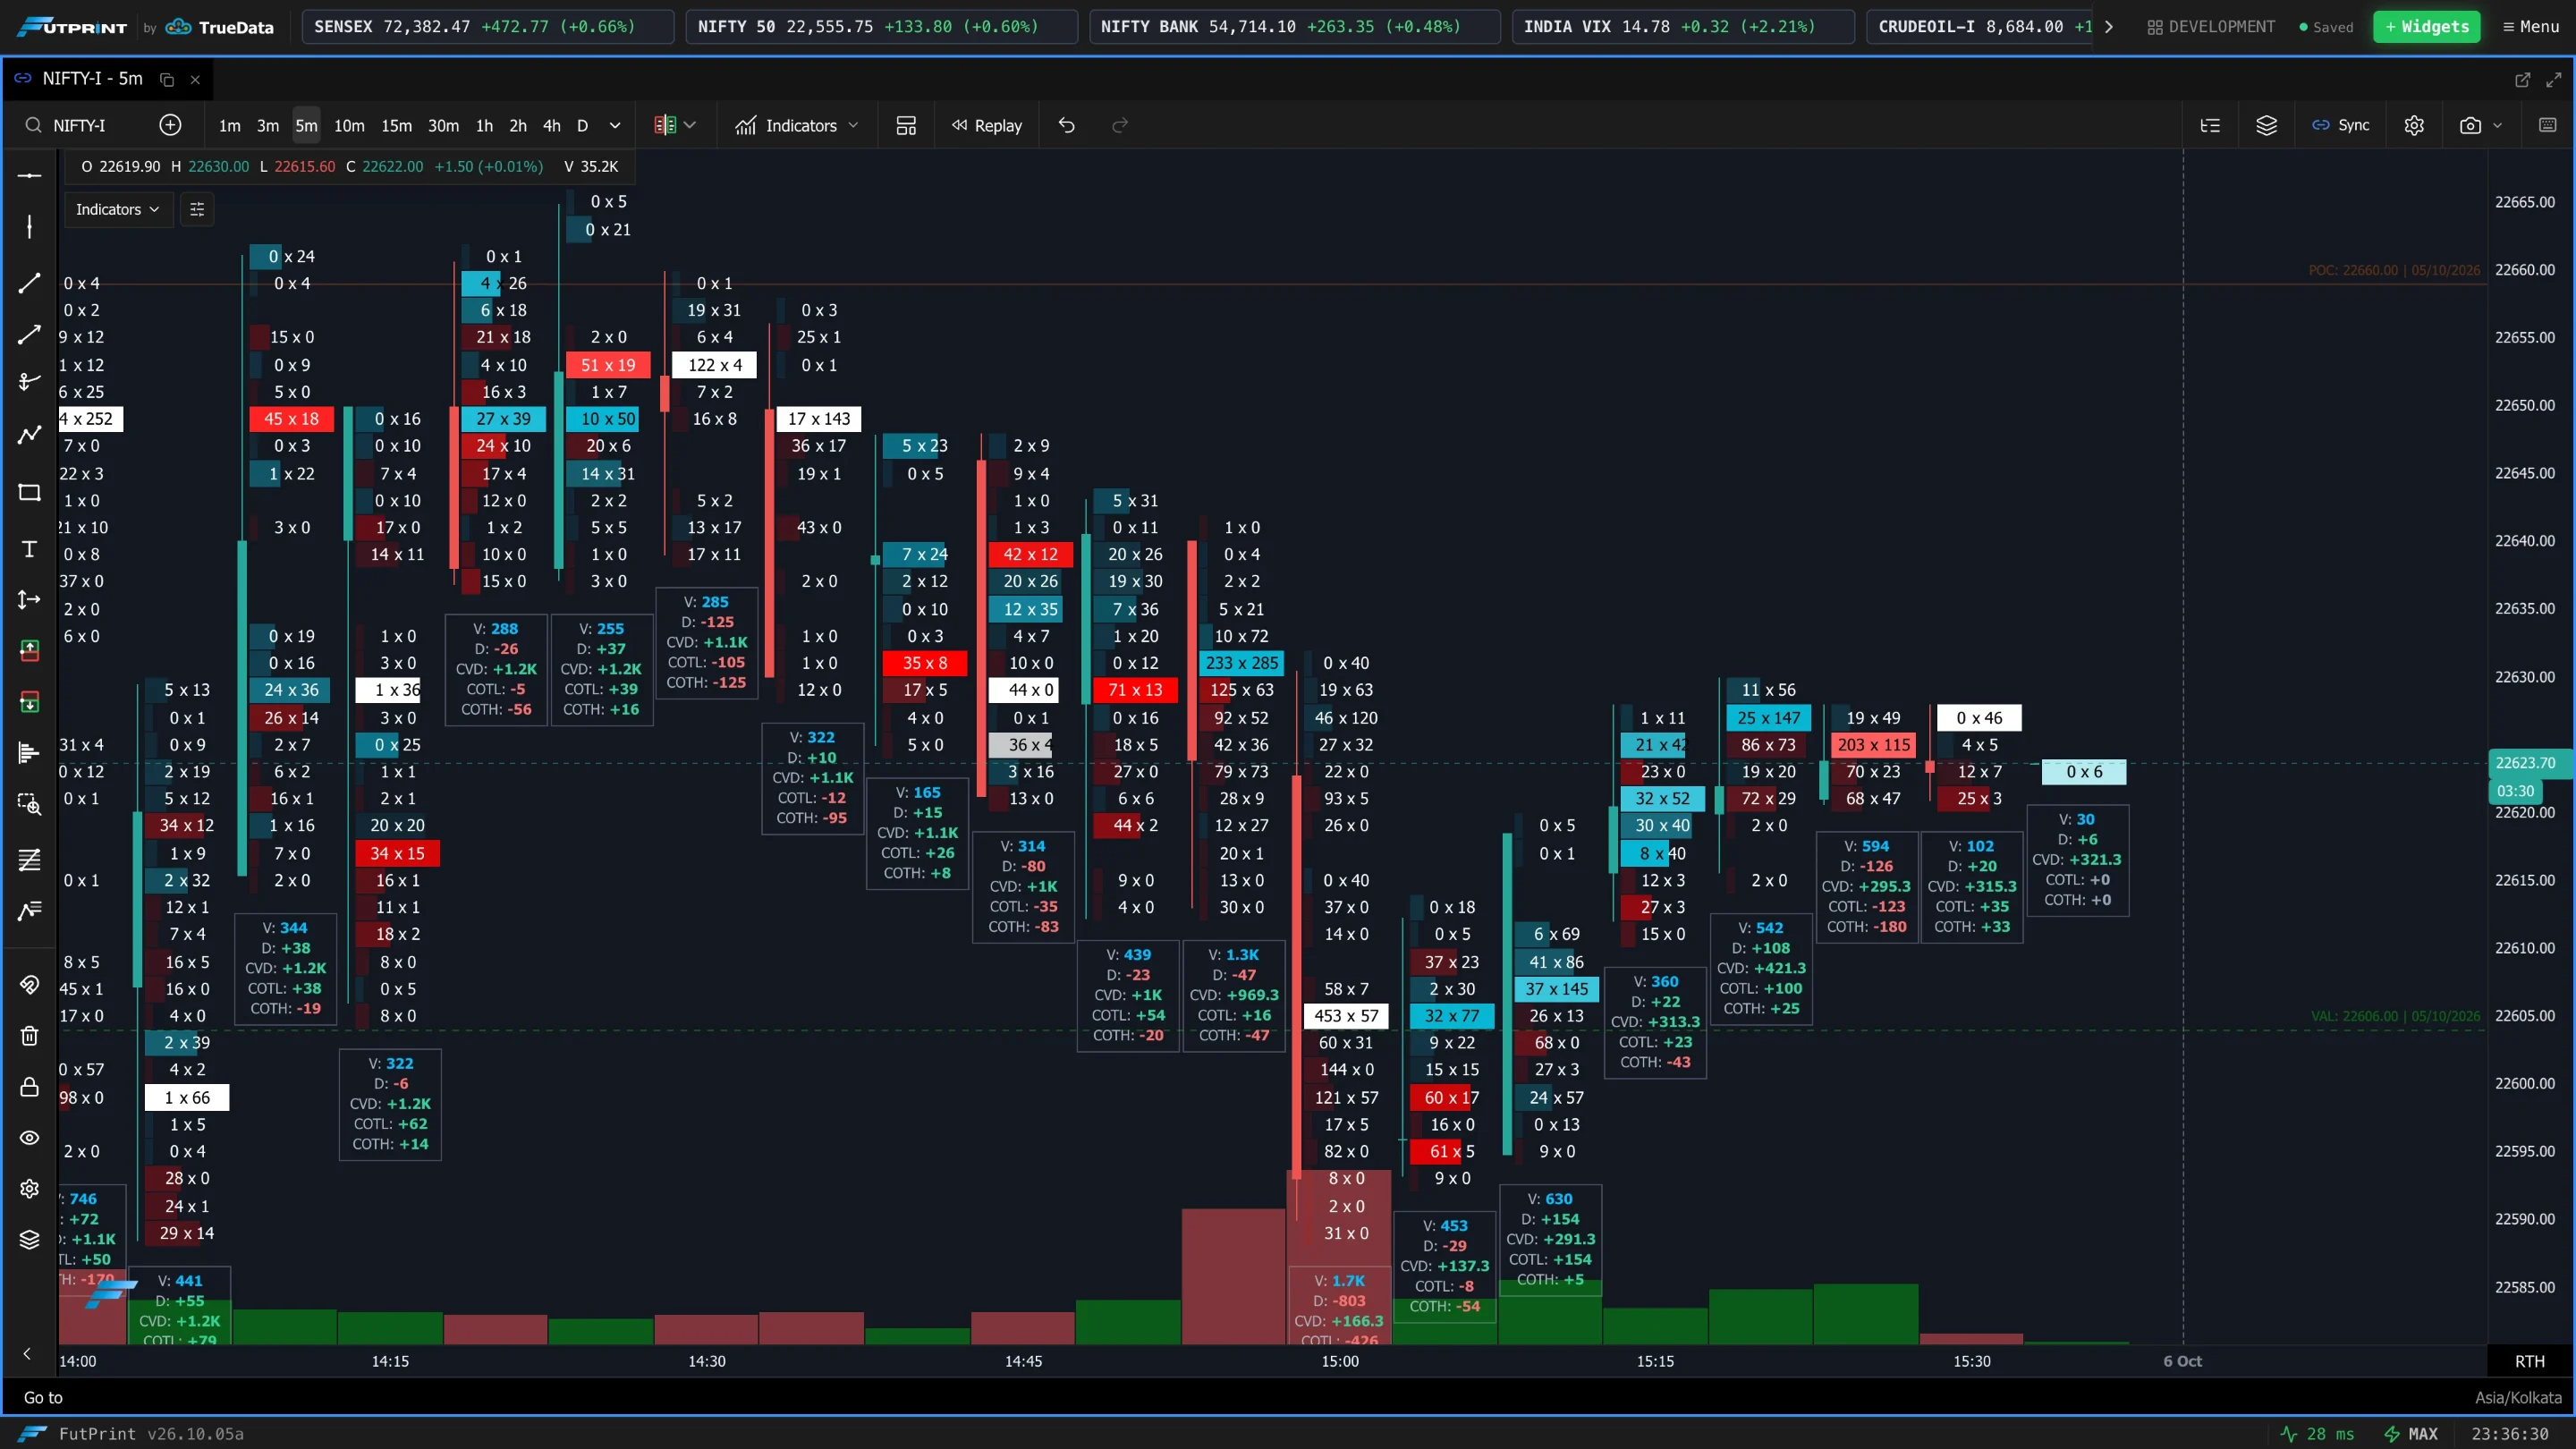
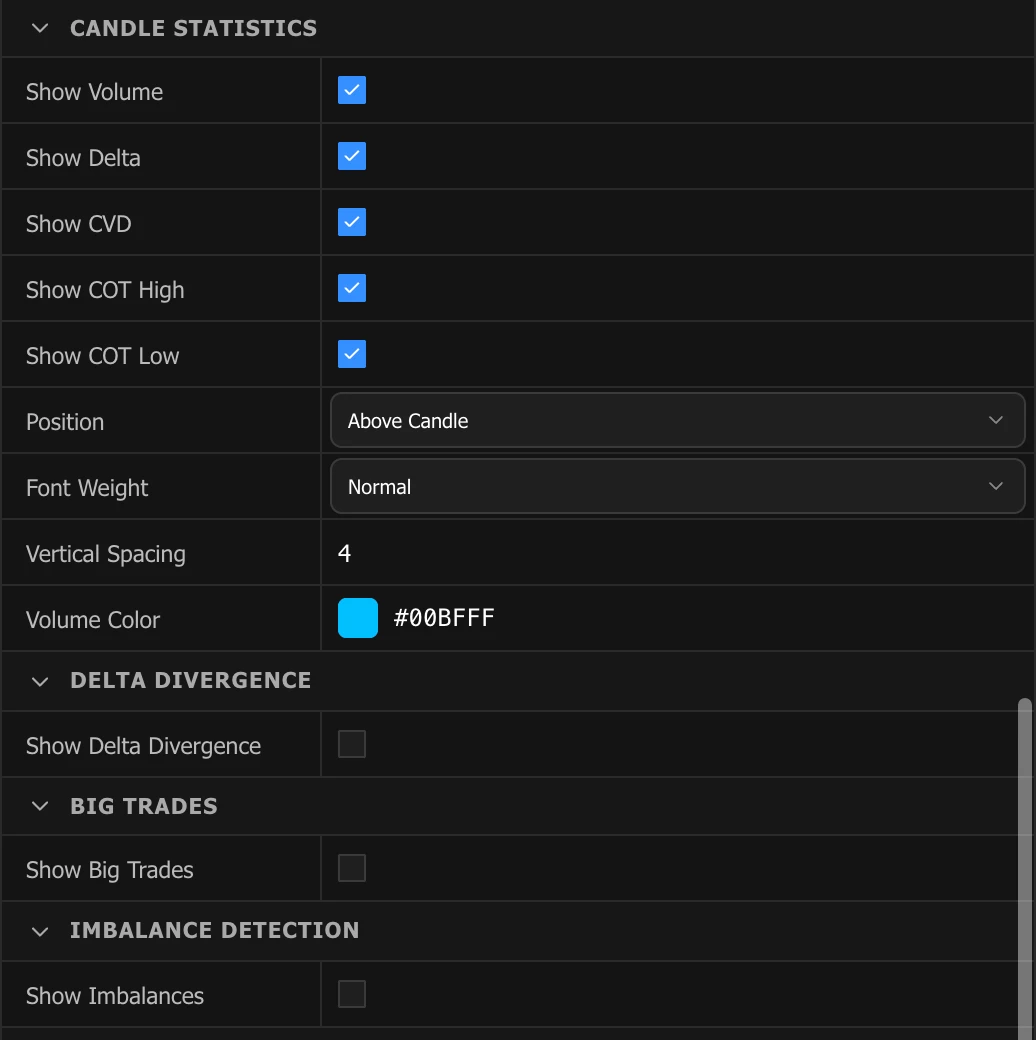
Candle Statistics
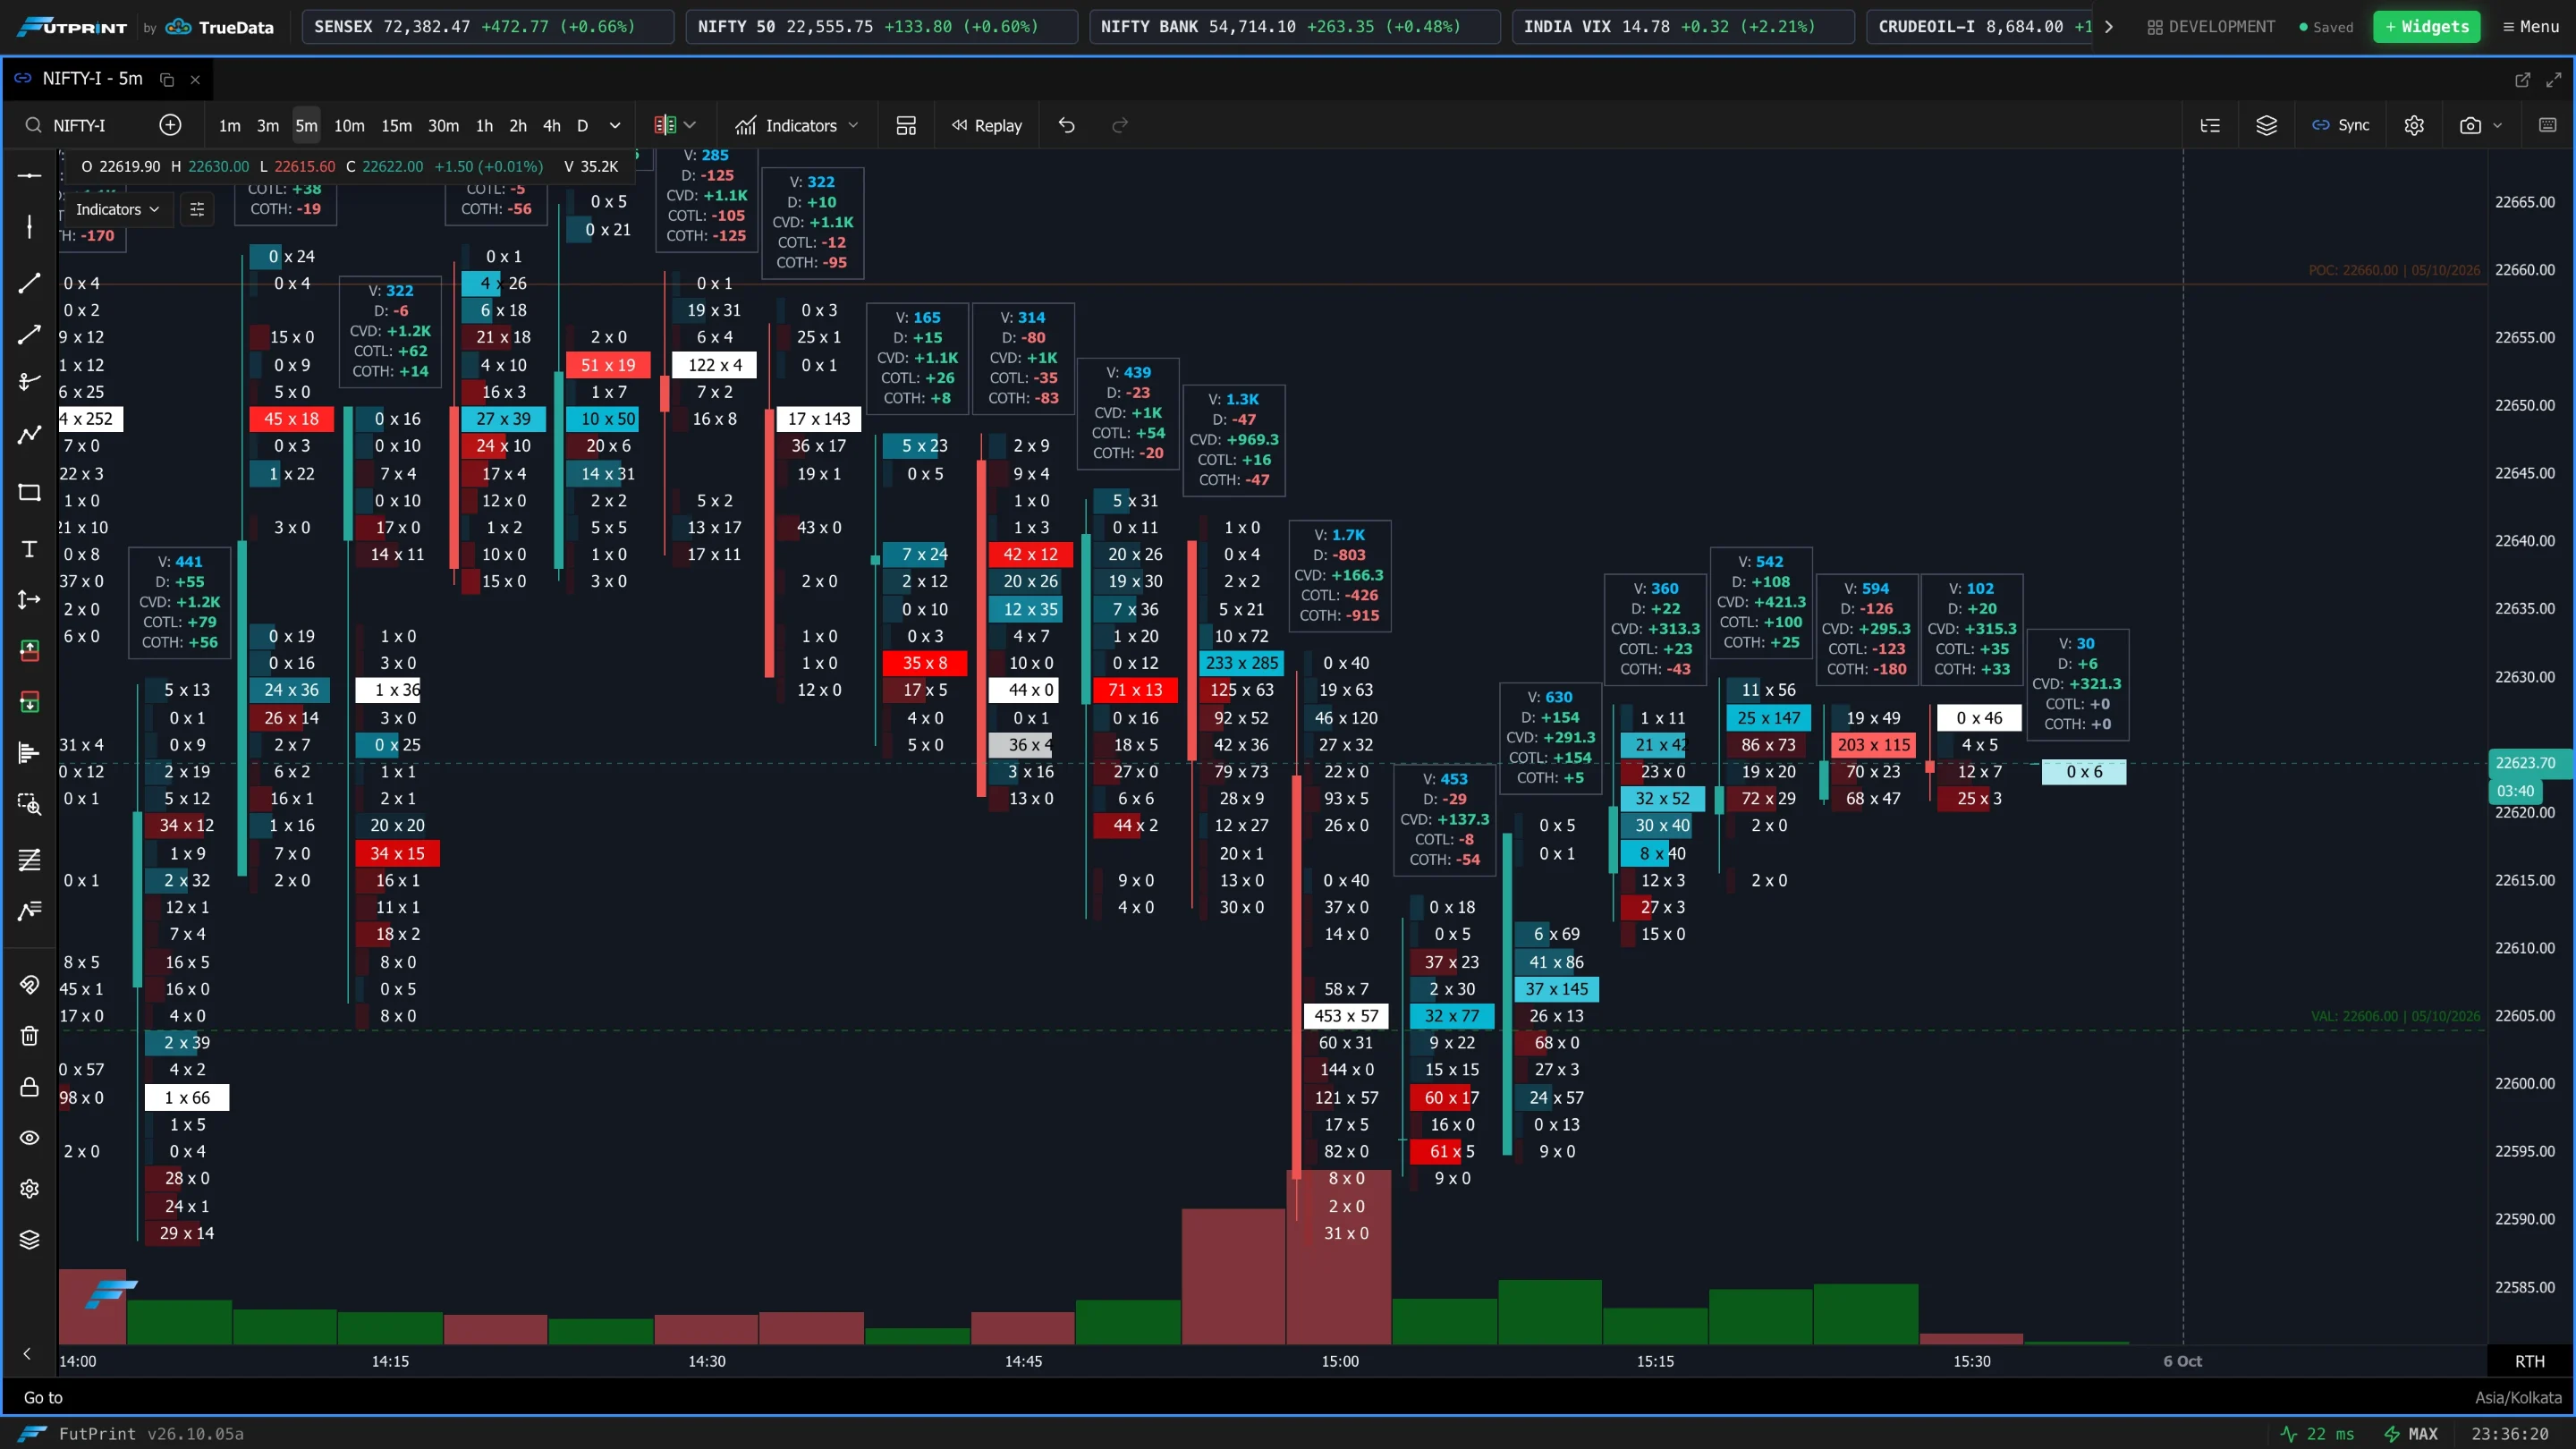
Numeric stats printed above or below each candle.
| Setting | What it does |
|---|---|
| Show Volume | Total volume of the candle. |
| Show Delta | Candle delta (buy − sell): positive = buying pressure, negative = selling. |
| Show CVD | Cumulative volume delta — the running total of delta over time, for sustained pressure. |
| Show COT High | Signed volume traded after a new high forms (positive = buying, negative = selling). |
| Show COT Low | Signed volume traded after a new low forms. |
| Position | Place the stats Above Candle or Below Candle. |
| Font Weight | Normal or Bold. |
| Show Labels | Show descriptive labels next to each stat value. |
| Vertical Spacing | Gap between stacked stat lines. |
| Volume / Delta / CVD / COT High / COT Low Color | Individual colours for each stat. |
Delta Divergence
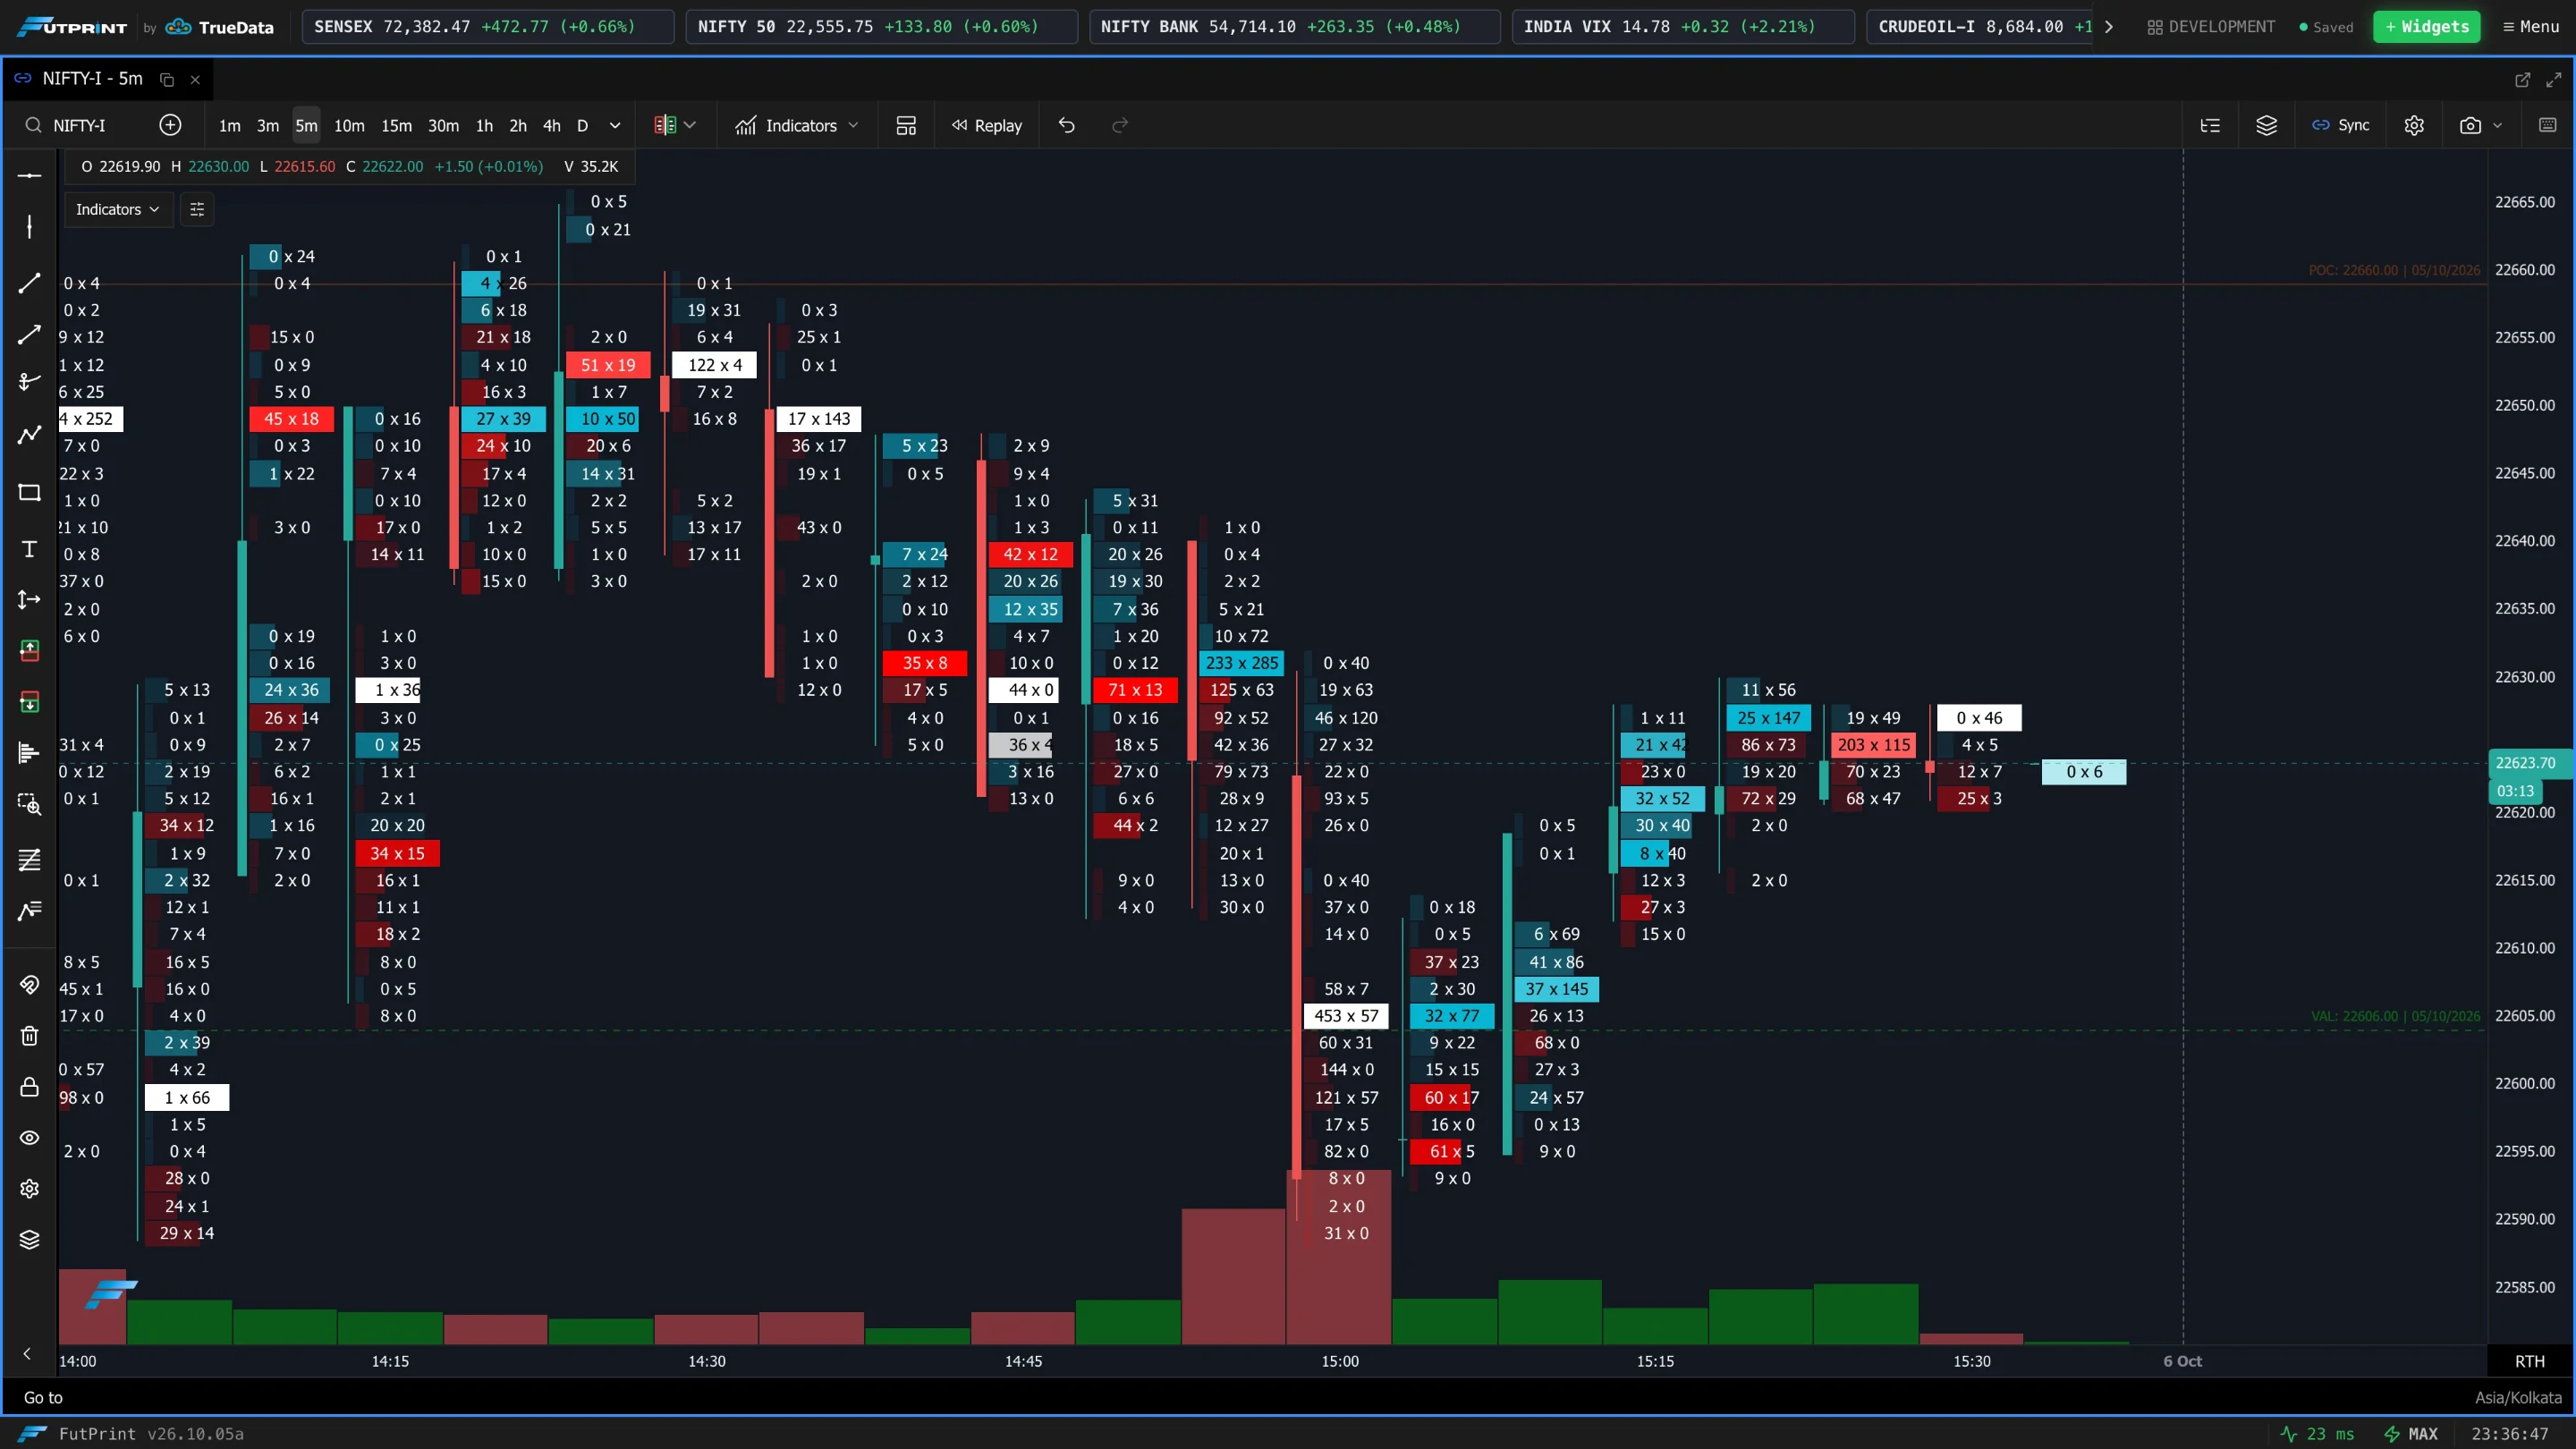
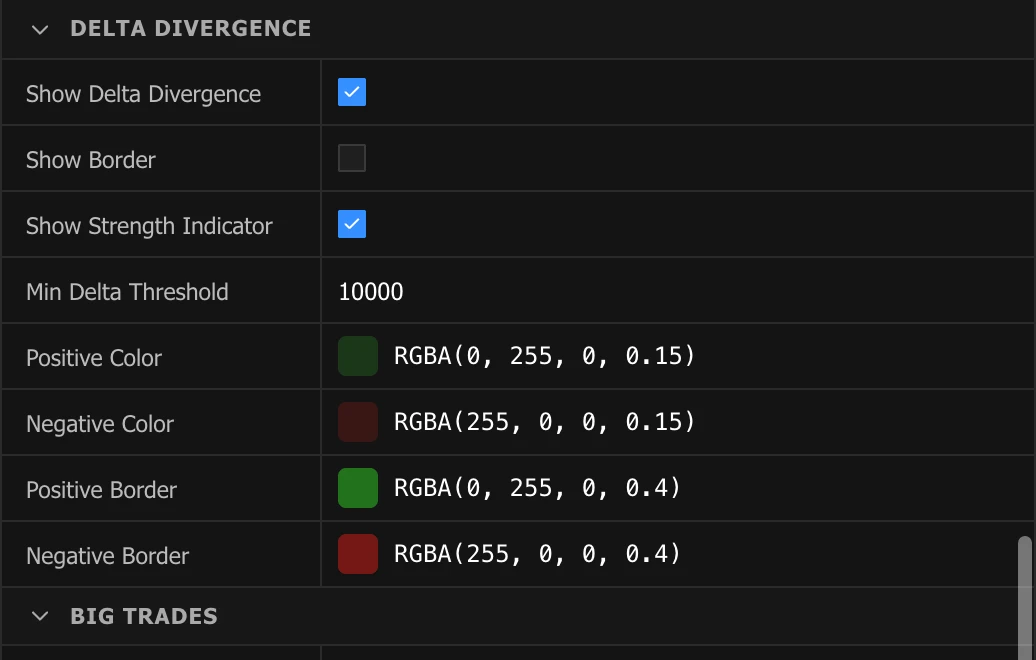
Highlights where price and delta disagree — e.g. price falls while delta shows strong buying — often a clue to reversals or continuation.
| Setting | What it does |
|---|---|
| Show Delta Divergence | Turn on divergence highlighting. |
| Show Border | Draw a border around divergence zones to define them clearly. |
| Show Strength Indicator | Add a bar whose height/intensity reflects the strength of the divergence. |
| Min Delta Threshold | Minimum delta volume needed to flag a divergence — raise it to filter weak signals, lower it to catch more. |
| Positive Color | Bullish divergence (price down, delta buying → possible up-reversal). |
| Negative Color | Bearish divergence (price up, delta selling → possible down-reversal). |
| Positive Border / Negative Border | Outline colours for each, usually a more opaque shade of the fill. |
Big Trades
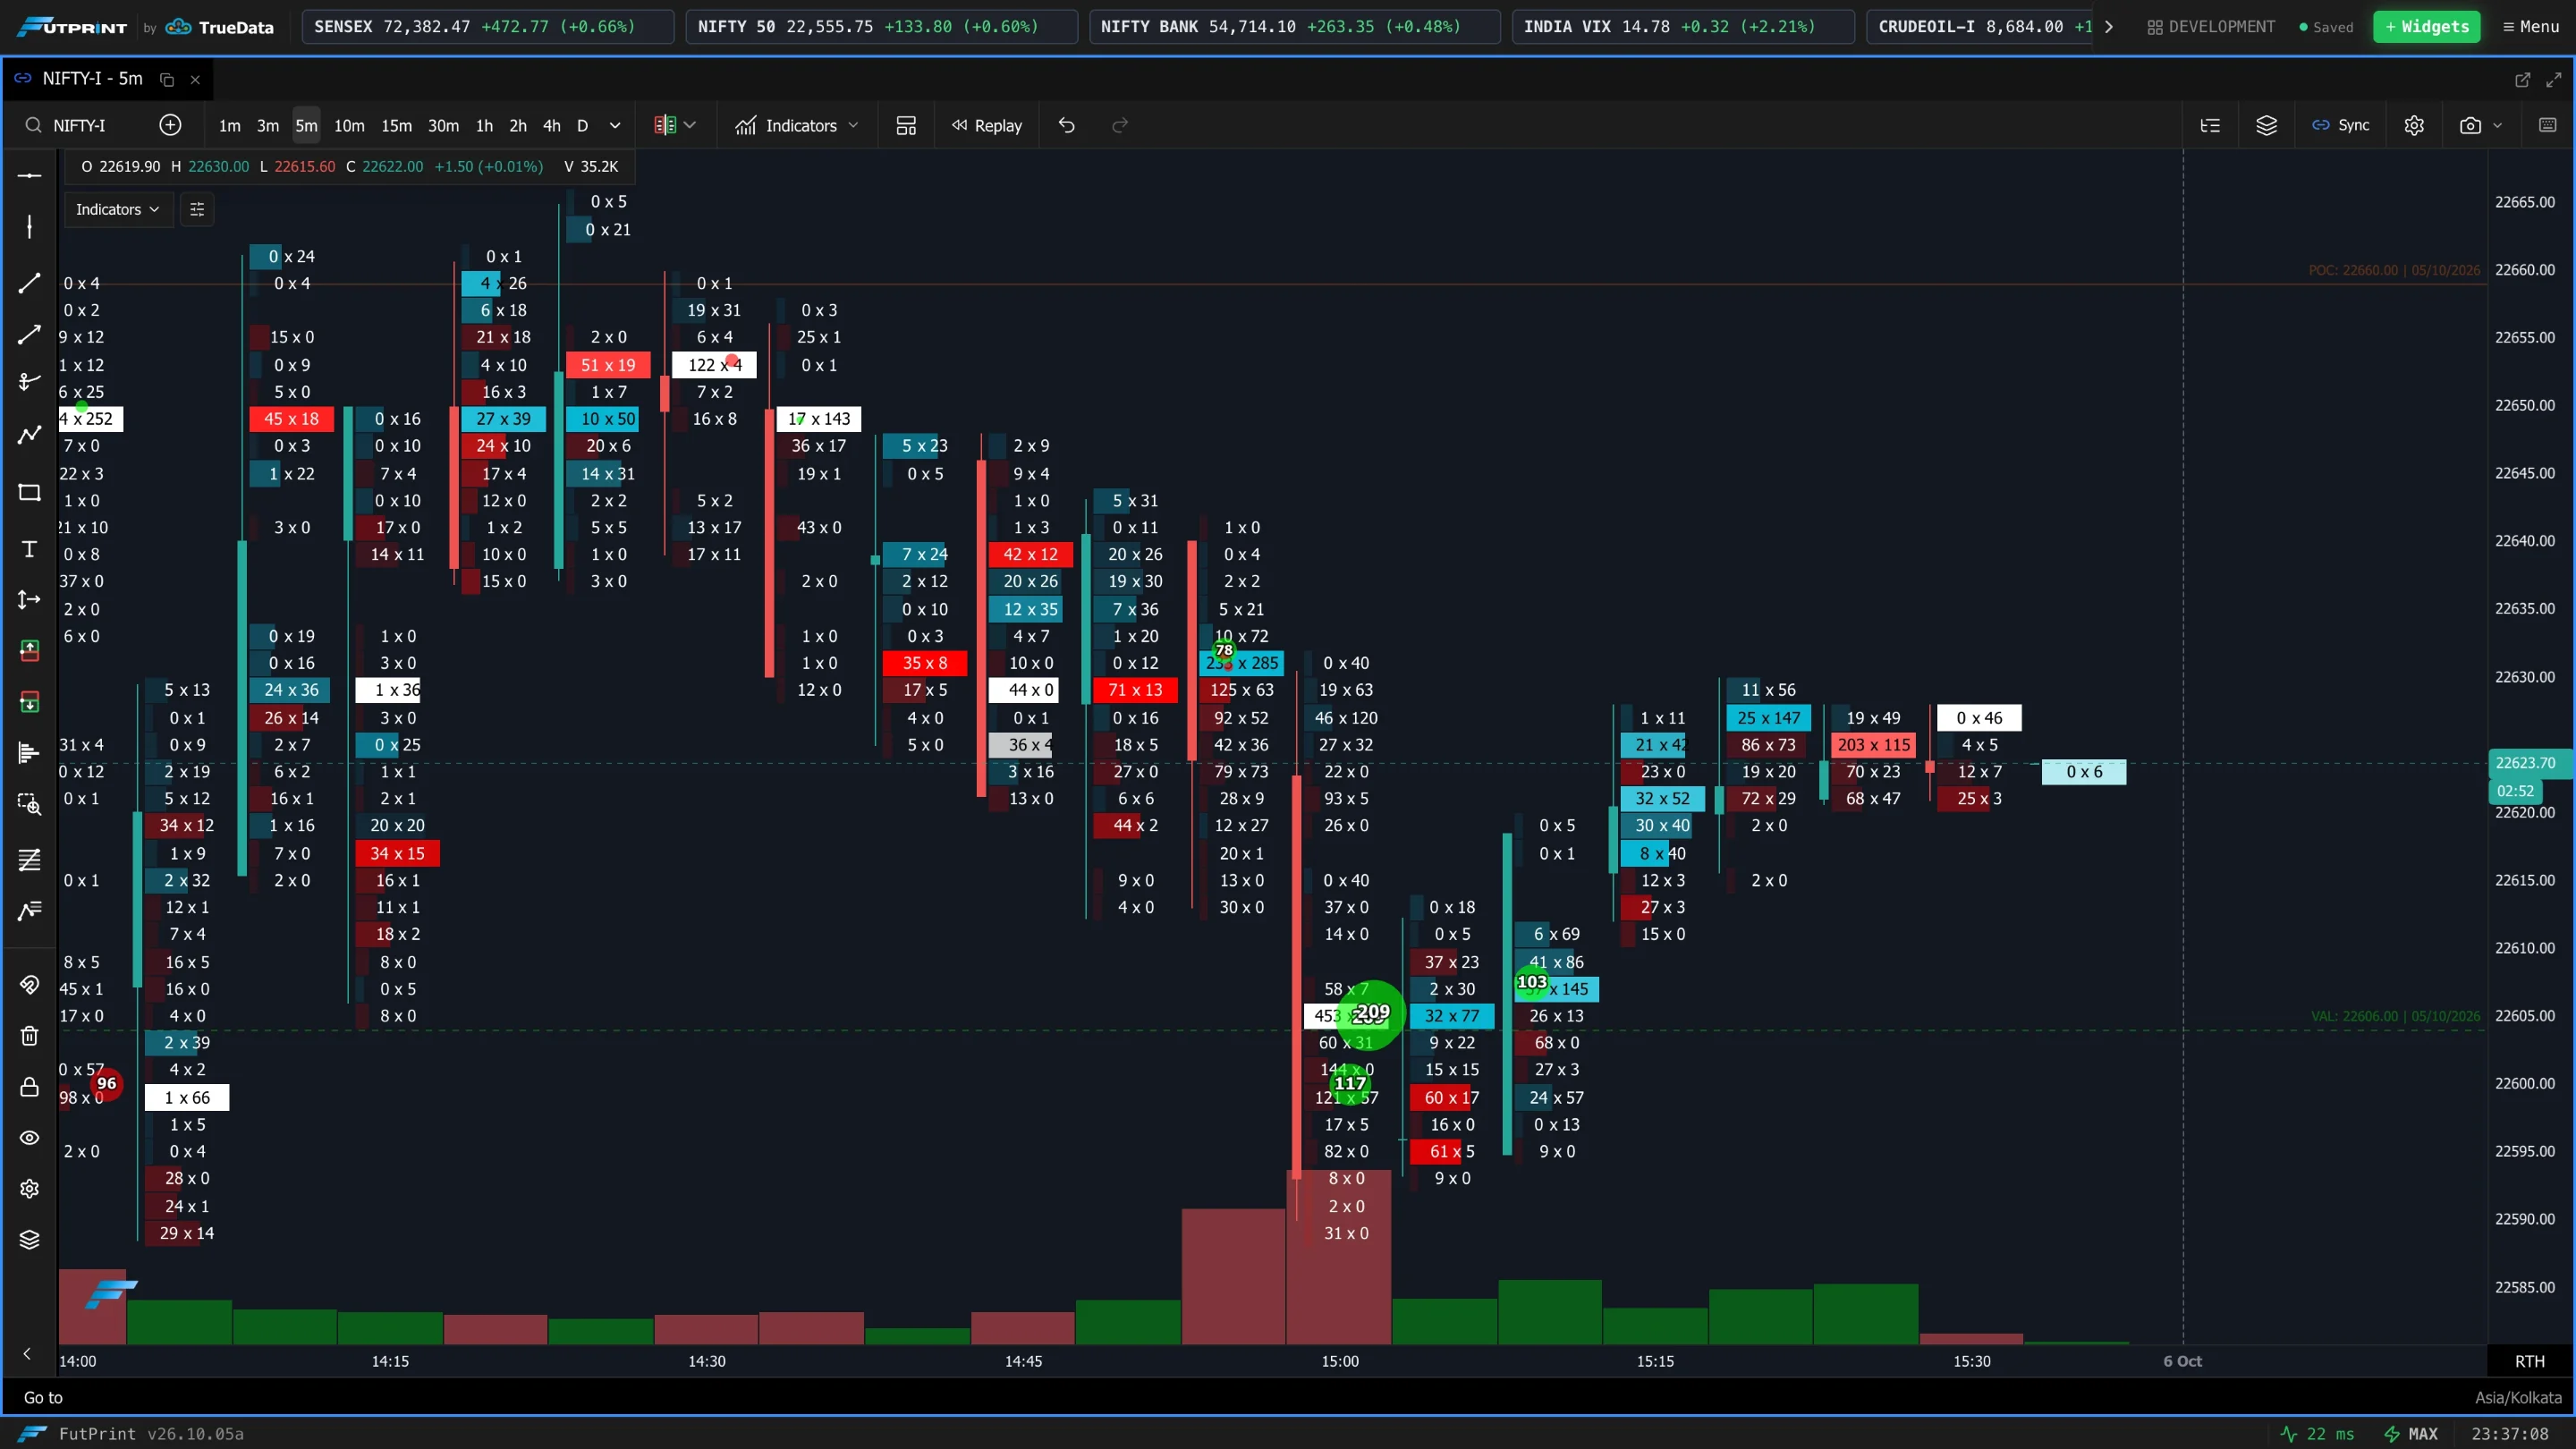
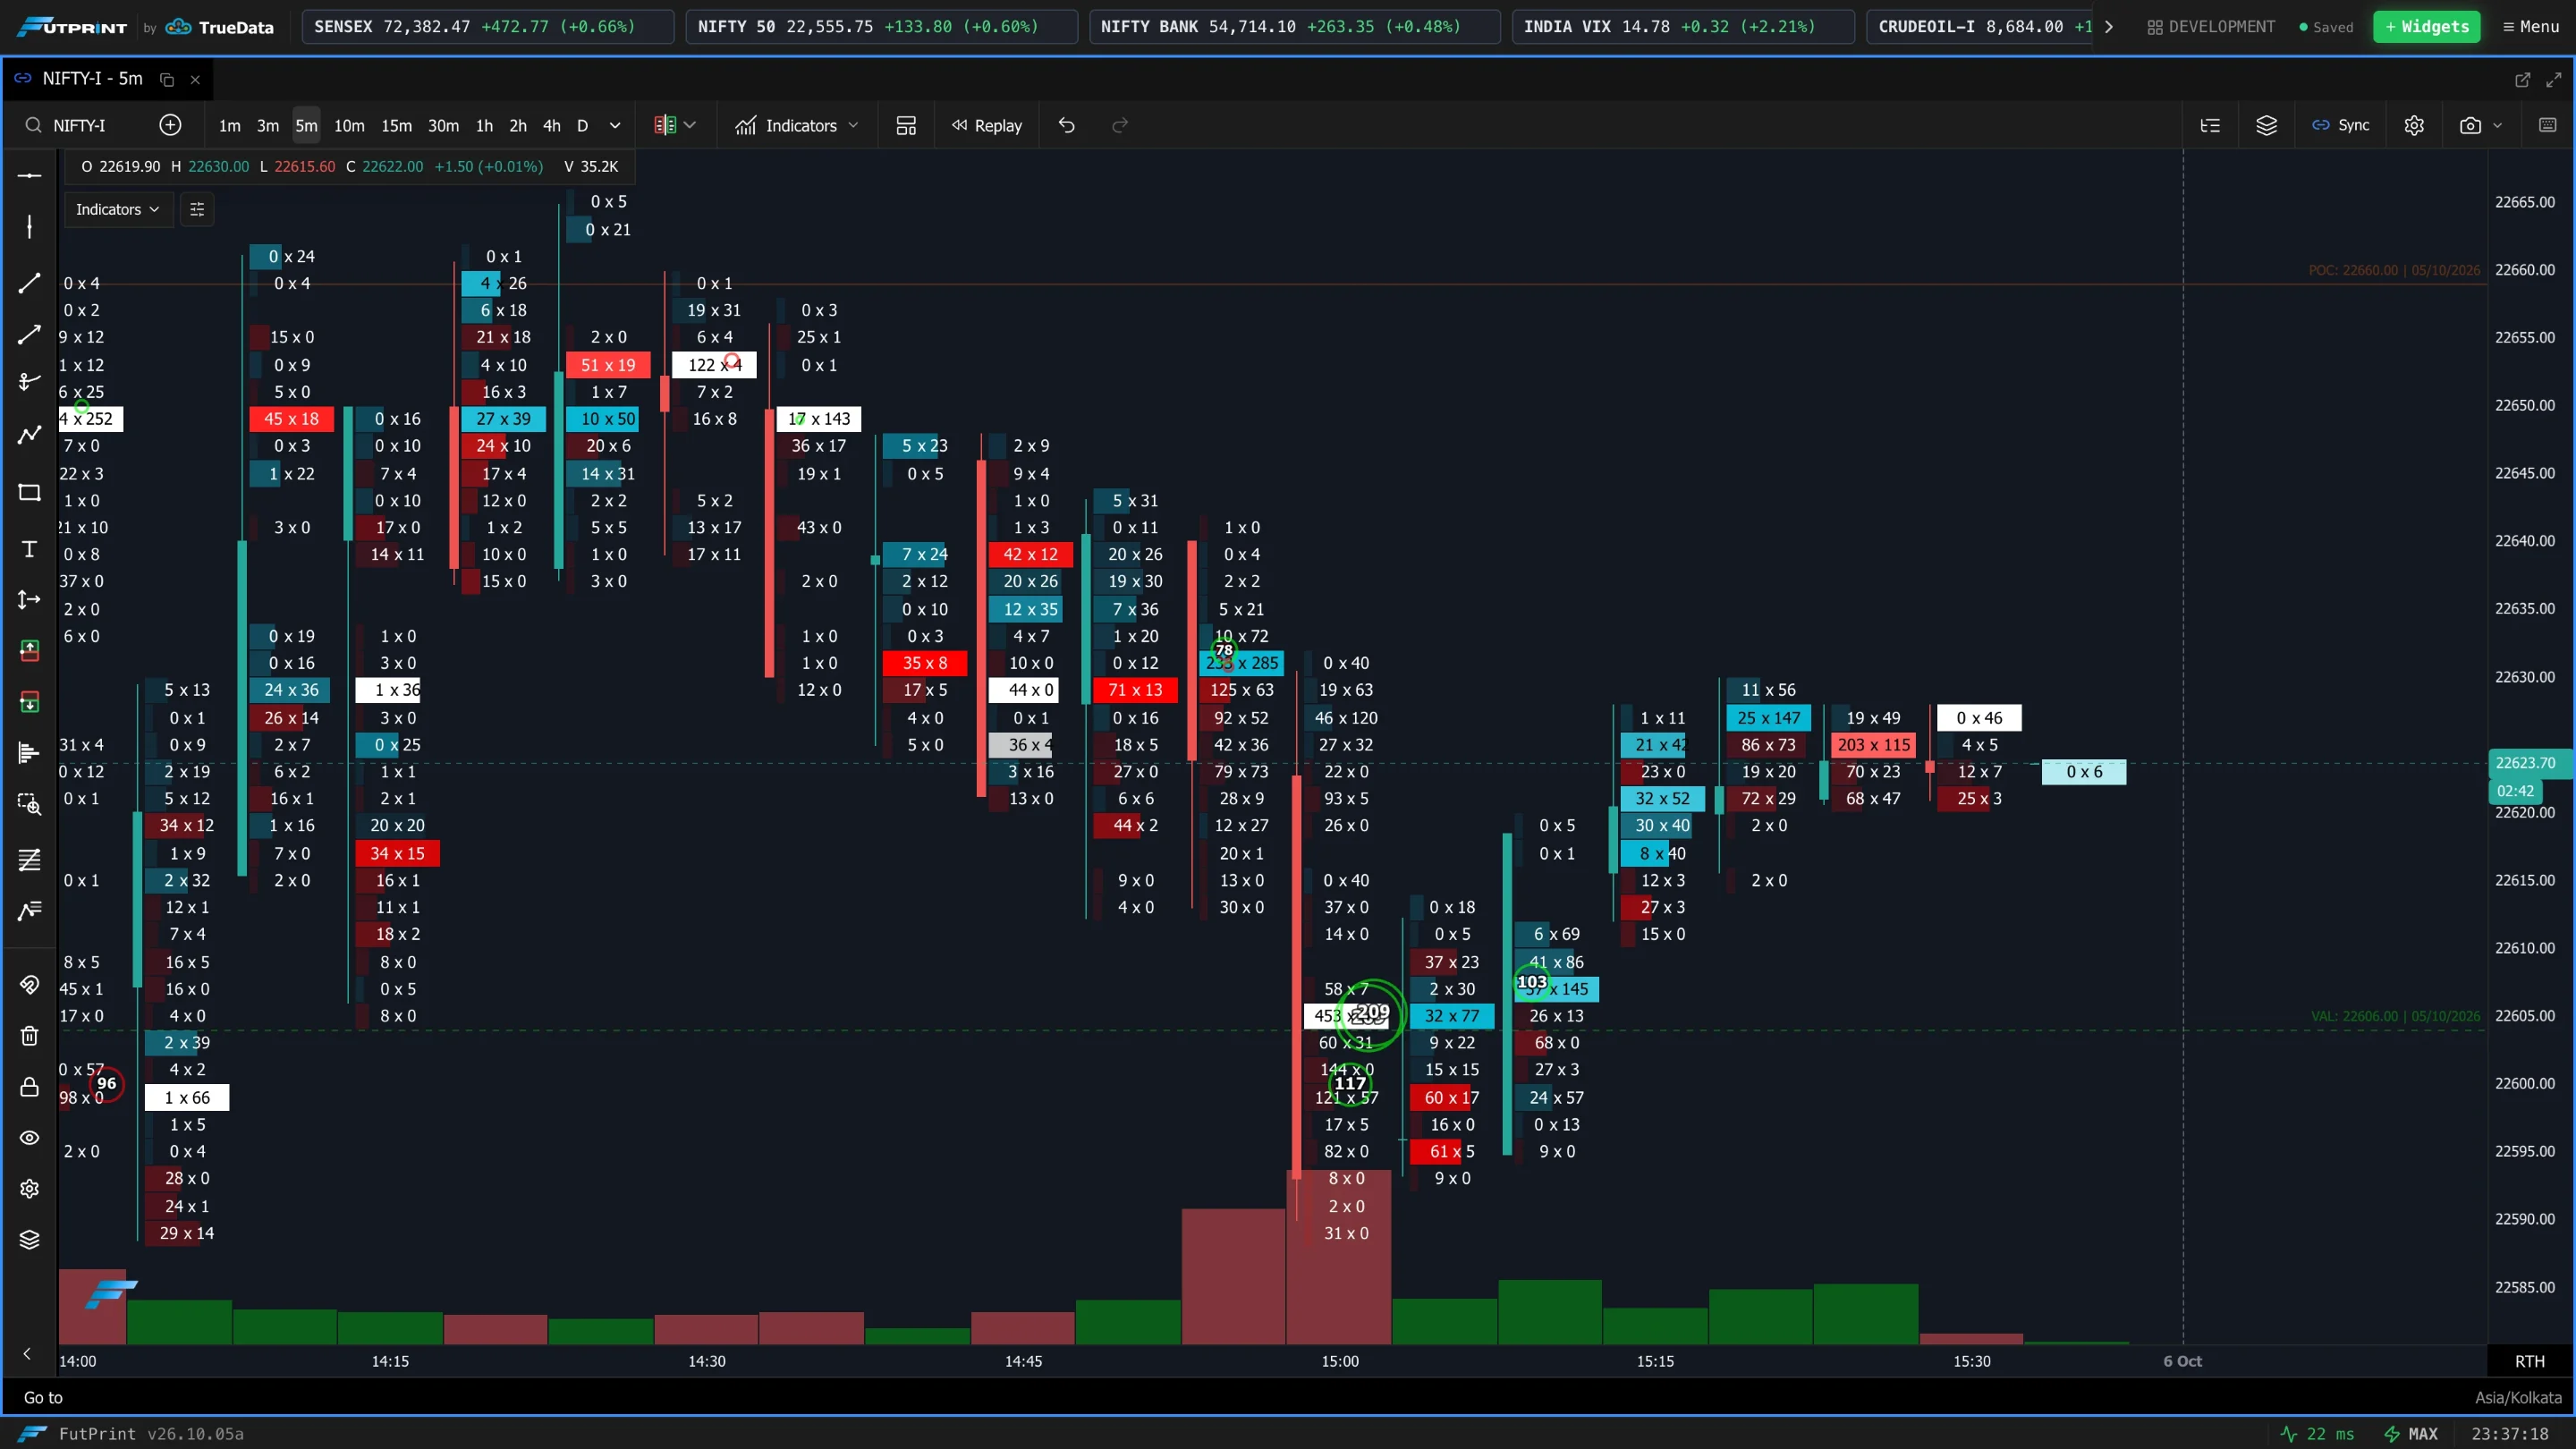
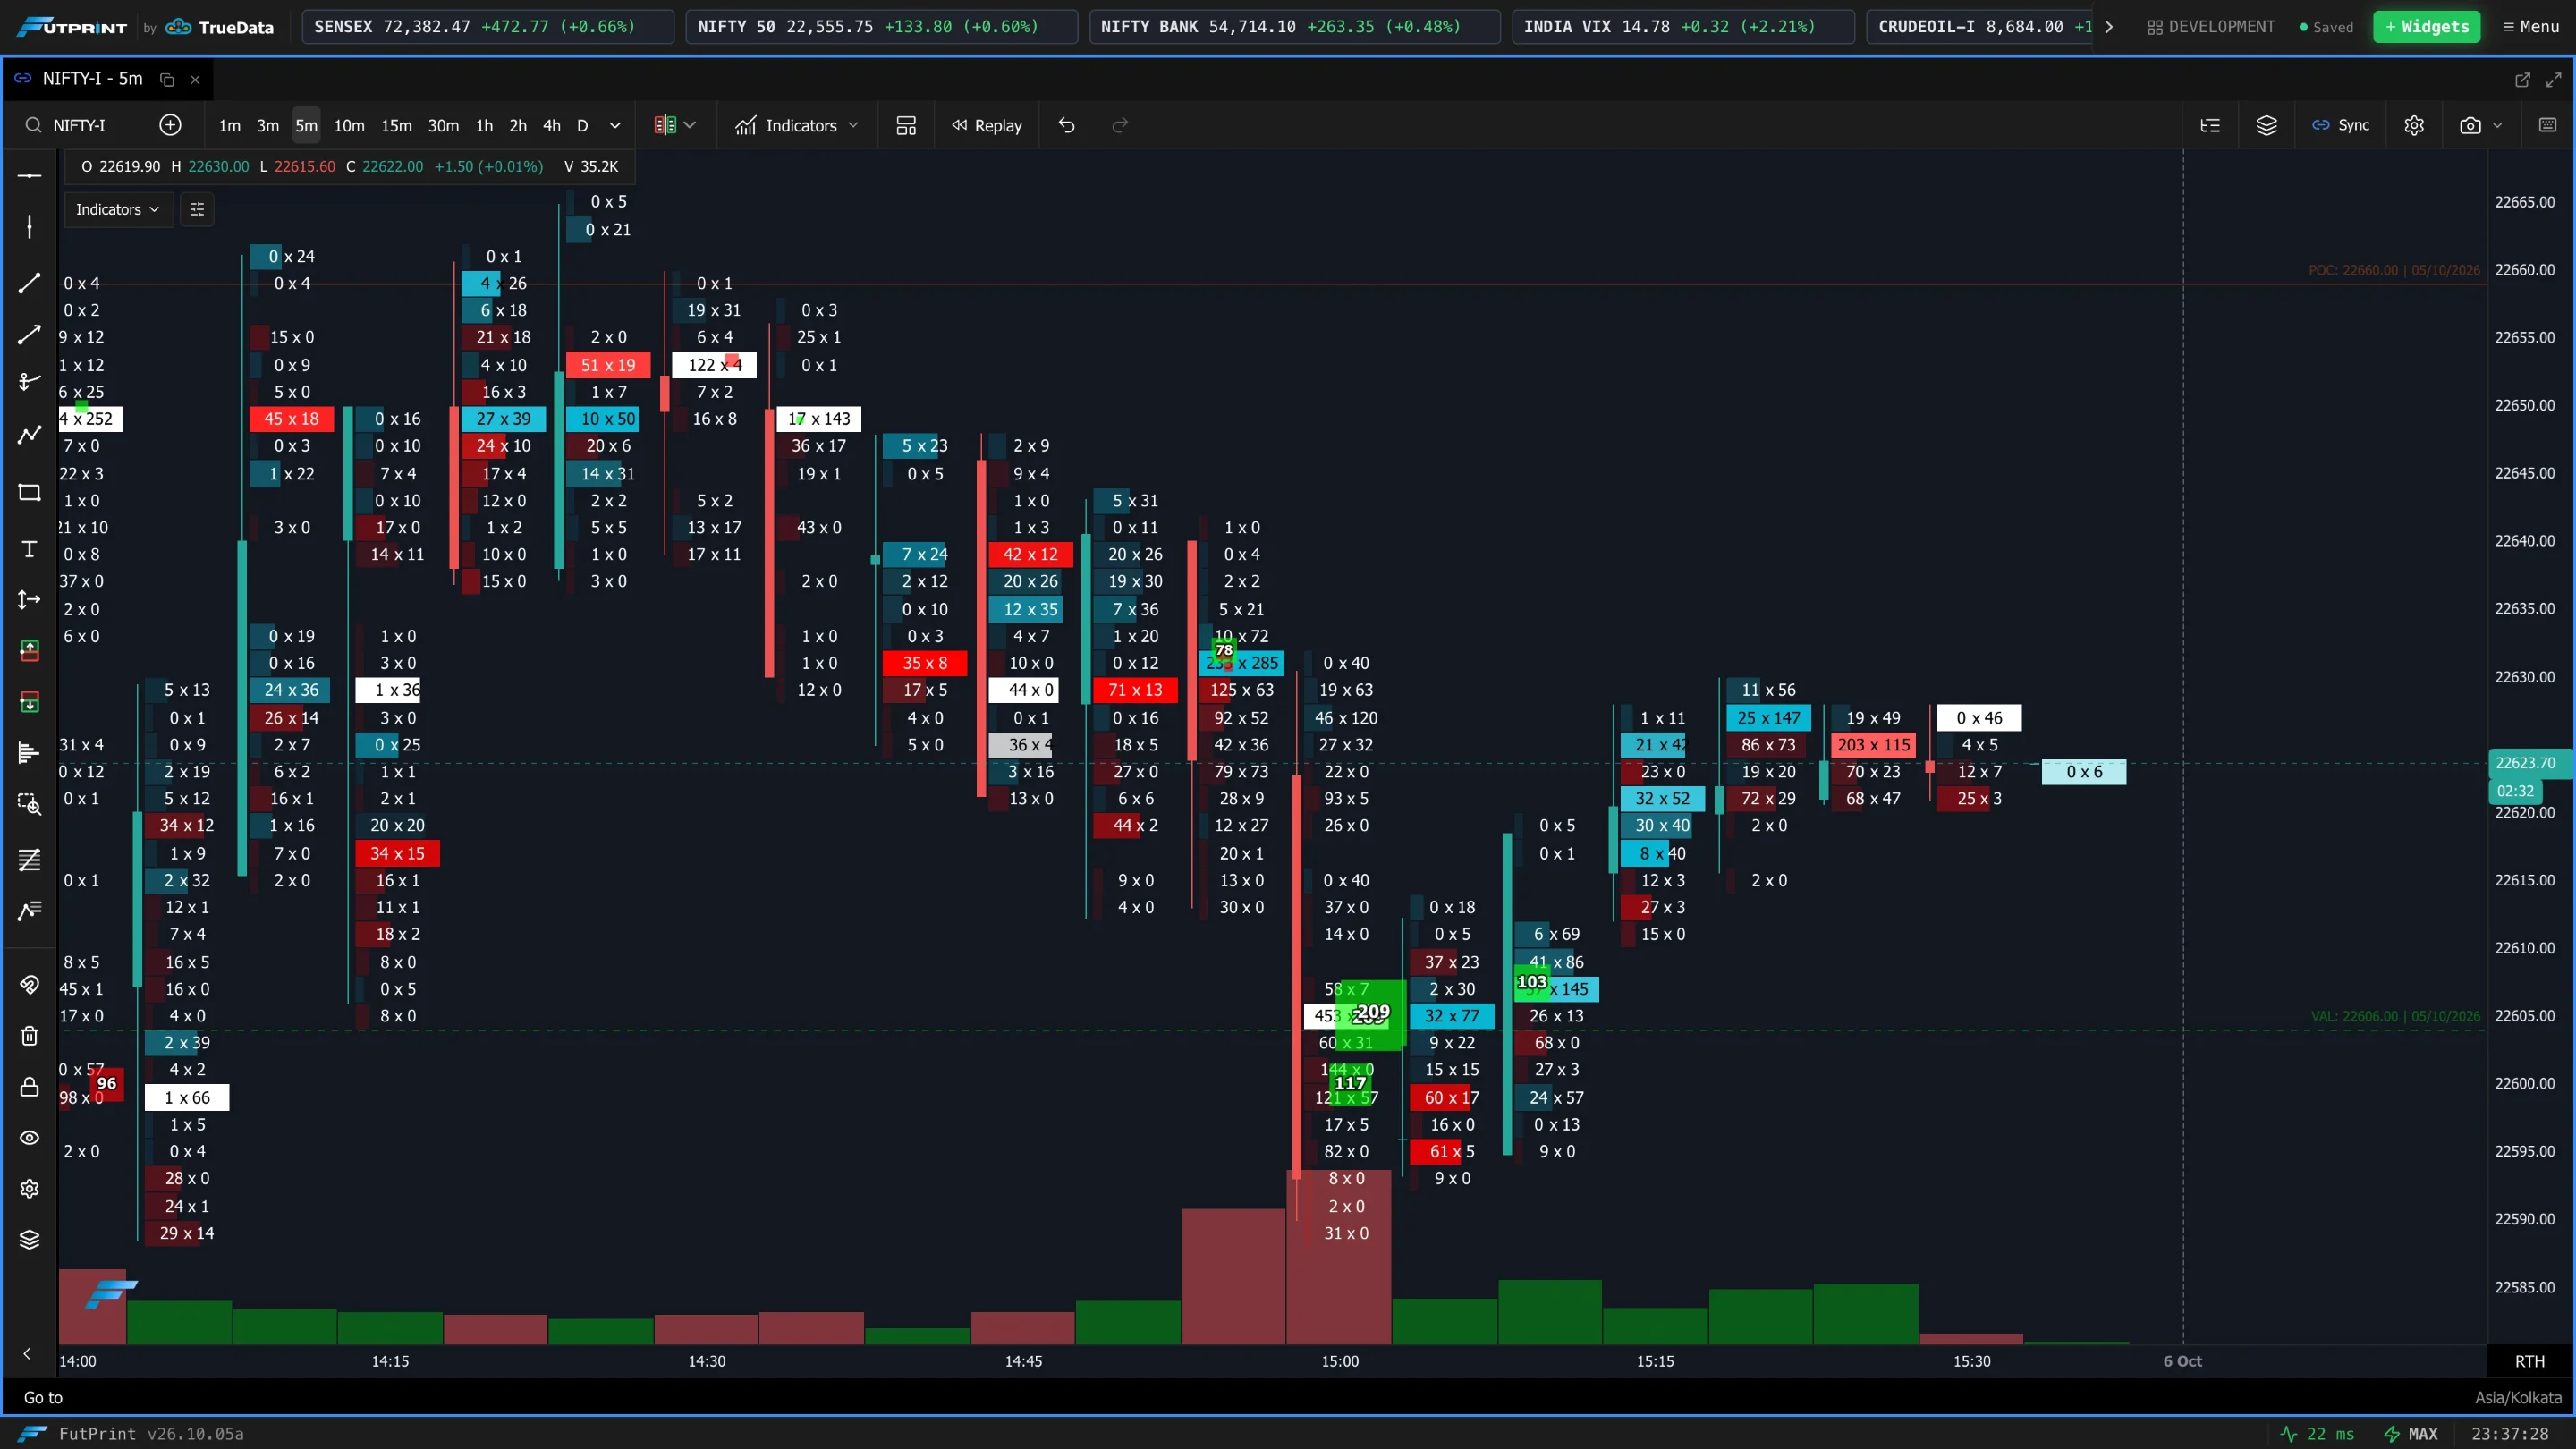
Plots large aggressive executions directly at their traded price. Historical markers are reconstructed from raw ticks; live markers use the realtime trade feed. Buy/sell classification uses bid/ask quotes when available and falls back to the tick rule. A marker is evidence of executed aggressive volume, not proof that it came from one institution.
| Setting | What it does |
|---|---|
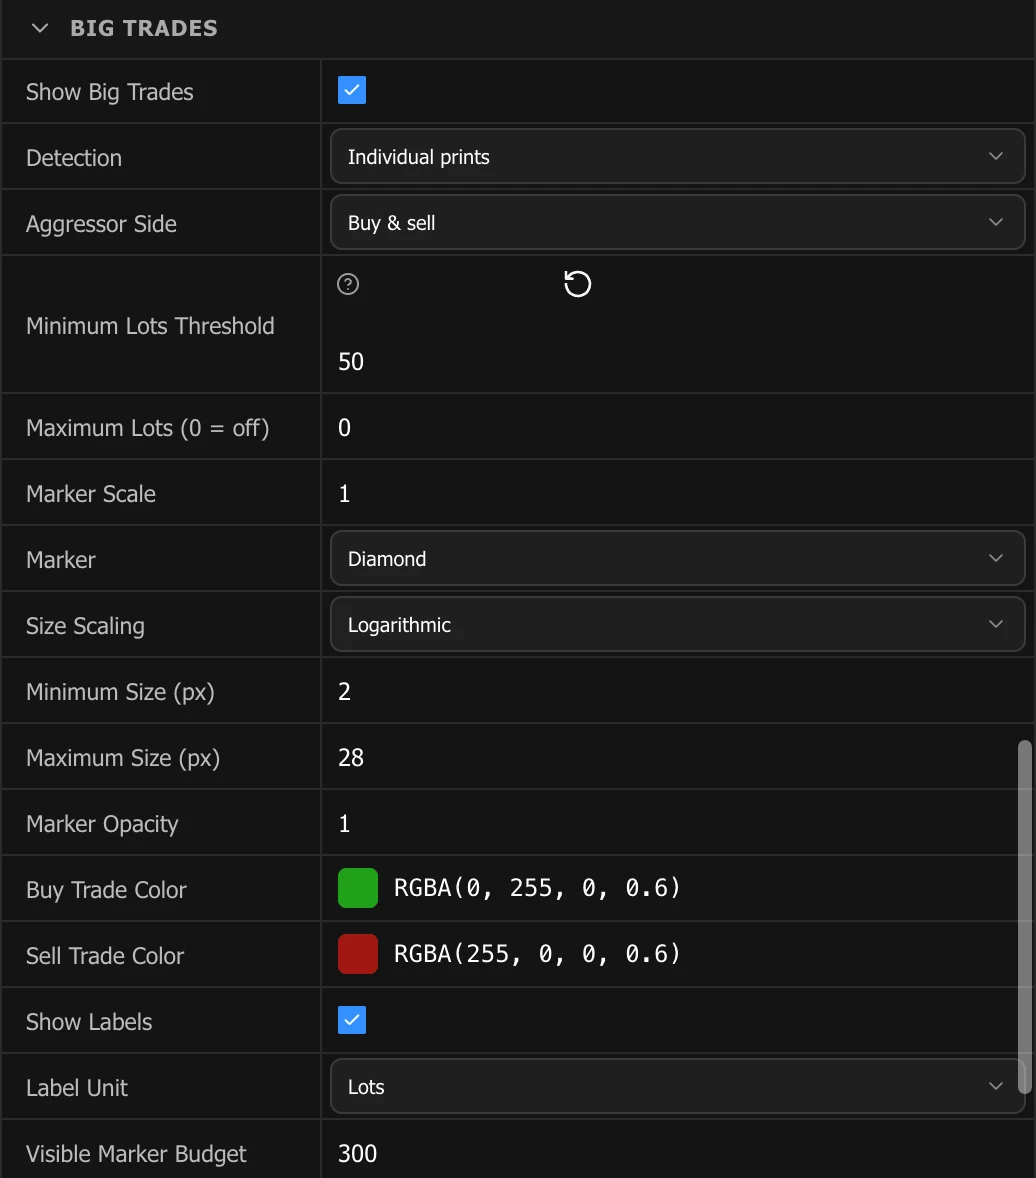
| Show Big Trades | Turn execution markers on or off. |
| Detection | Individual evaluates each exchange print. Cumulative groups consecutive same-side prints. |
| Group Window / Price Tolerance | Control how cumulative prints are joined in time and price. |
| Aggressor Side | Show both sides, buys only or sells only. |
| Minimum / Maximum Lots | Define the displayed size band; zero disables the upper boundary. |
| Marker / Size Scaling / Size | Choose shape and stable threshold-relative sizing. |
| Marker Opacity / Buy / Sell Color | Control marker appearance by aggressor side. |
| Show Labels / Label Unit | Print lots or raw executed quantity inside readable markers. |
| Visible Marker Budget | Caps work per frame; the largest prints are retained in exceptionally dense views. |
Changing a detection filter reprocesses ticks in a background worker and does not request the same history again.
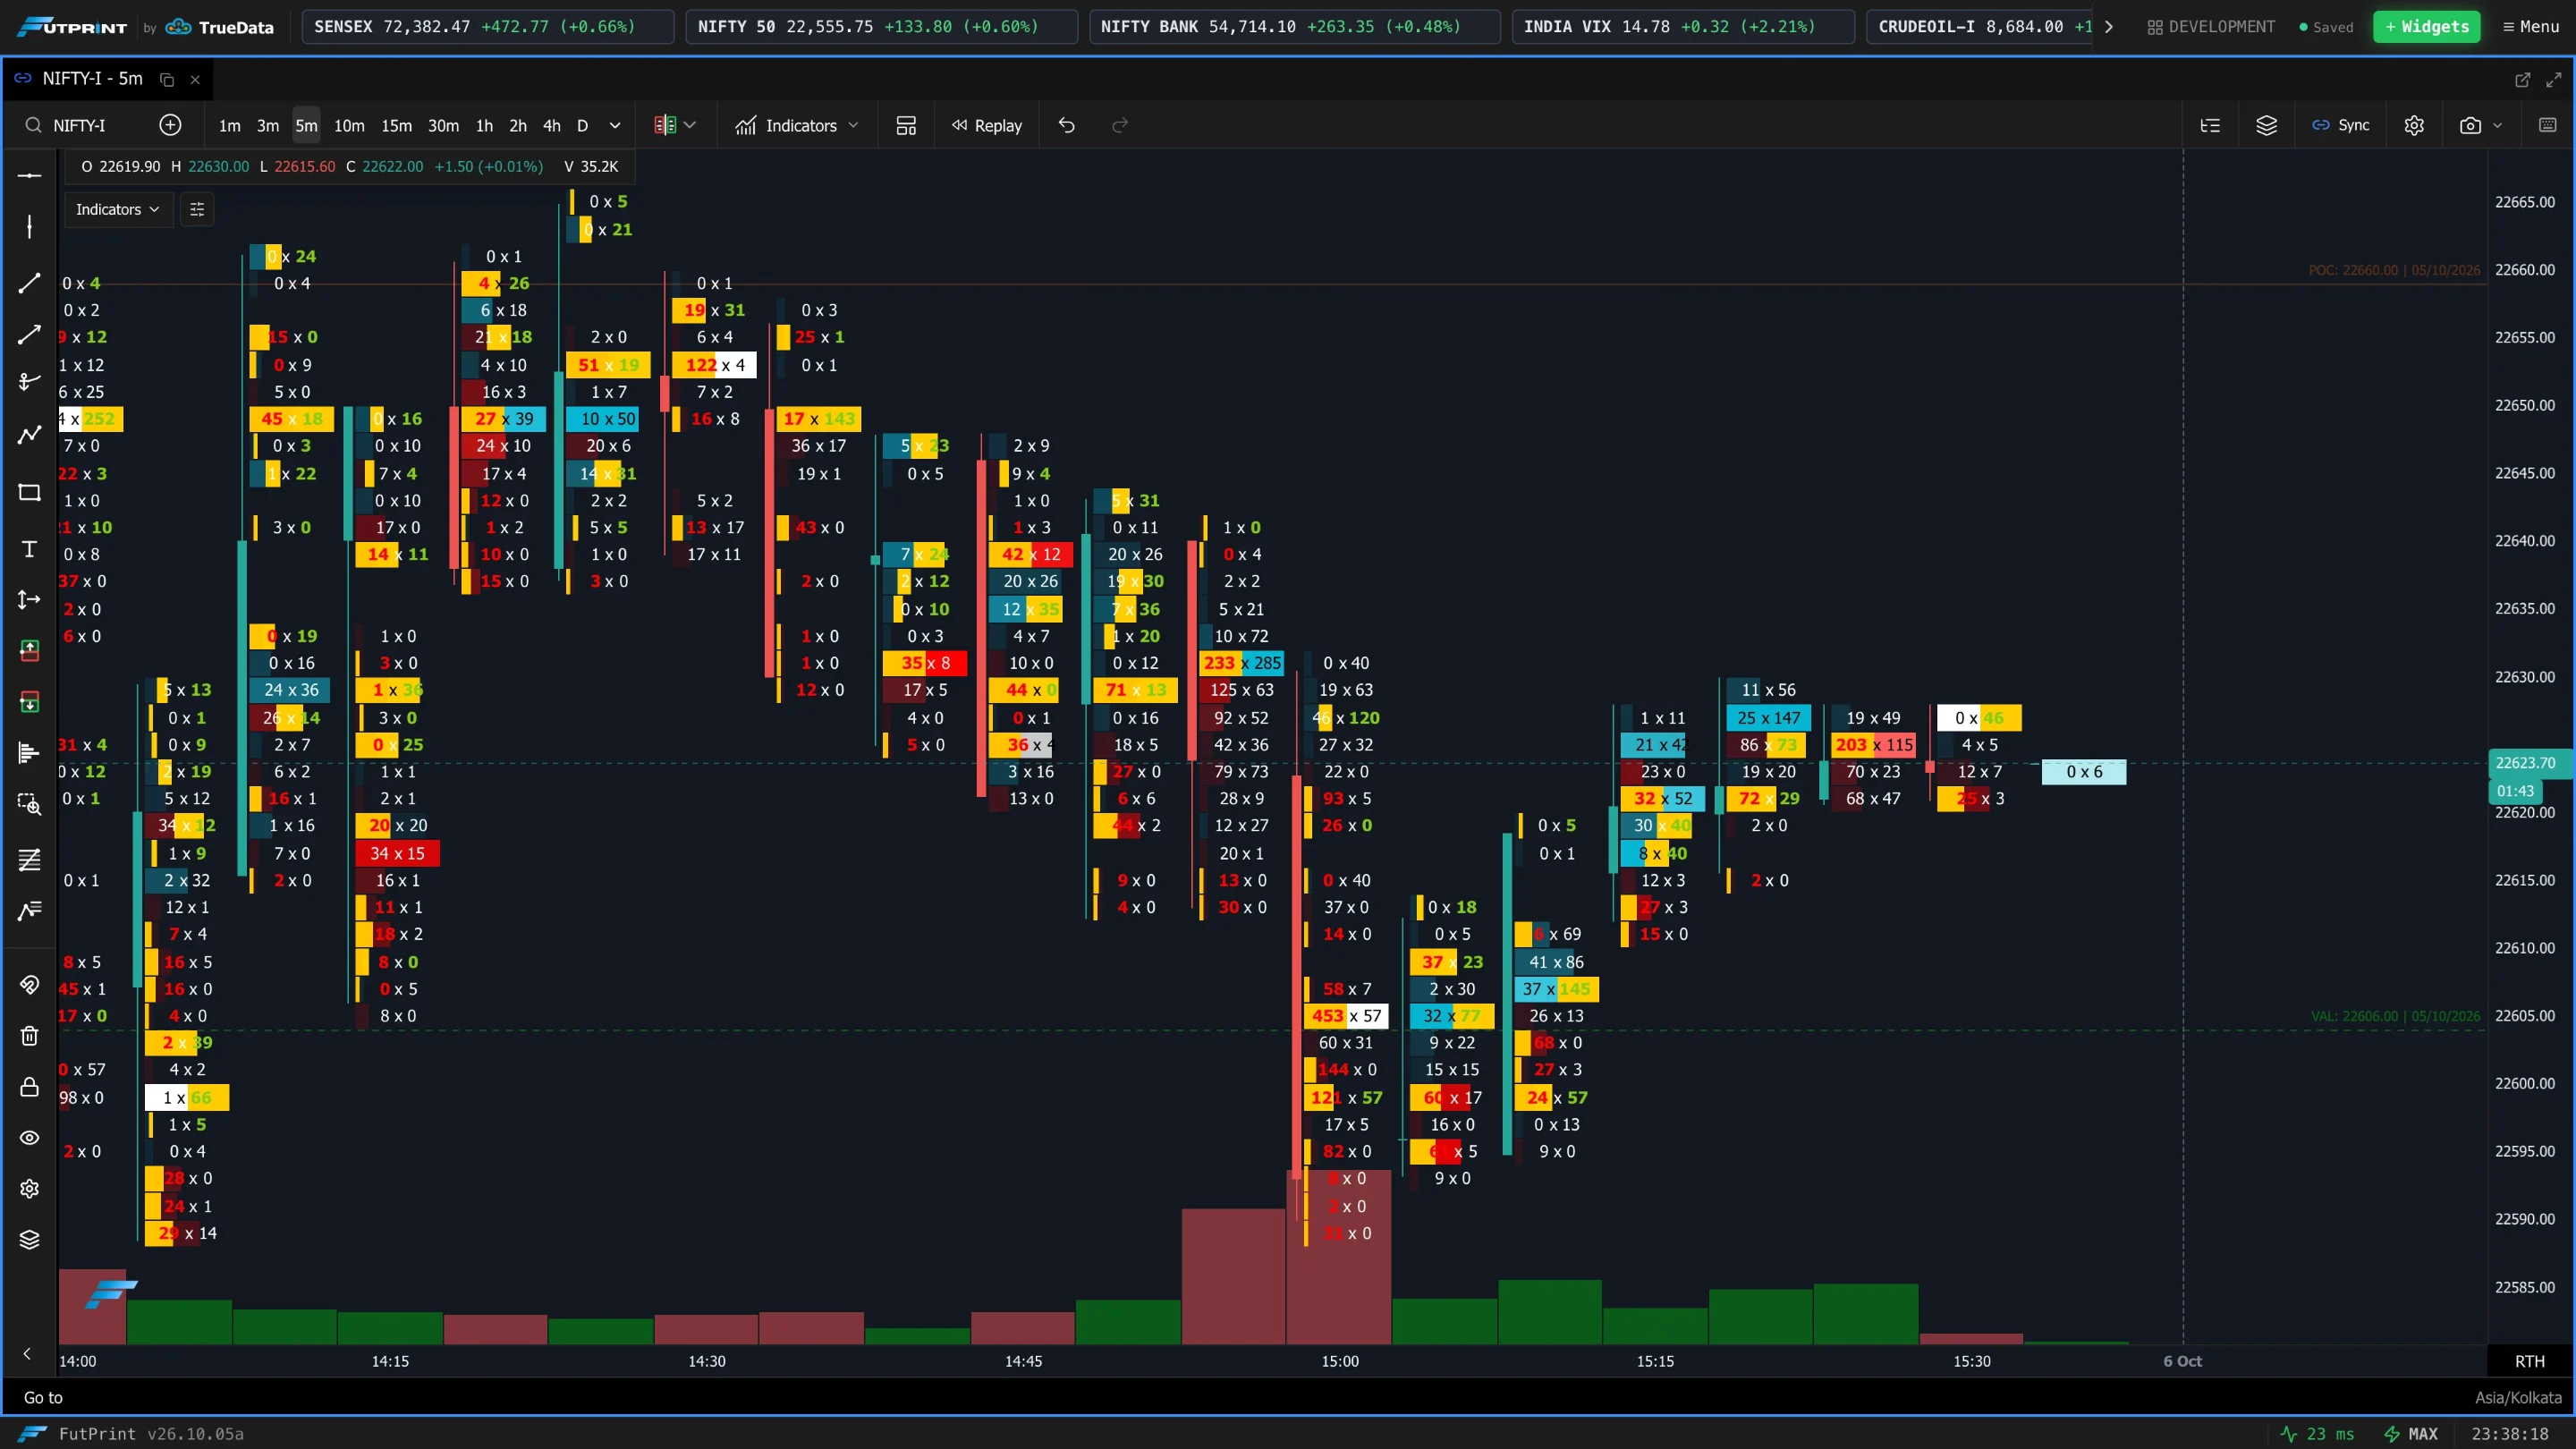
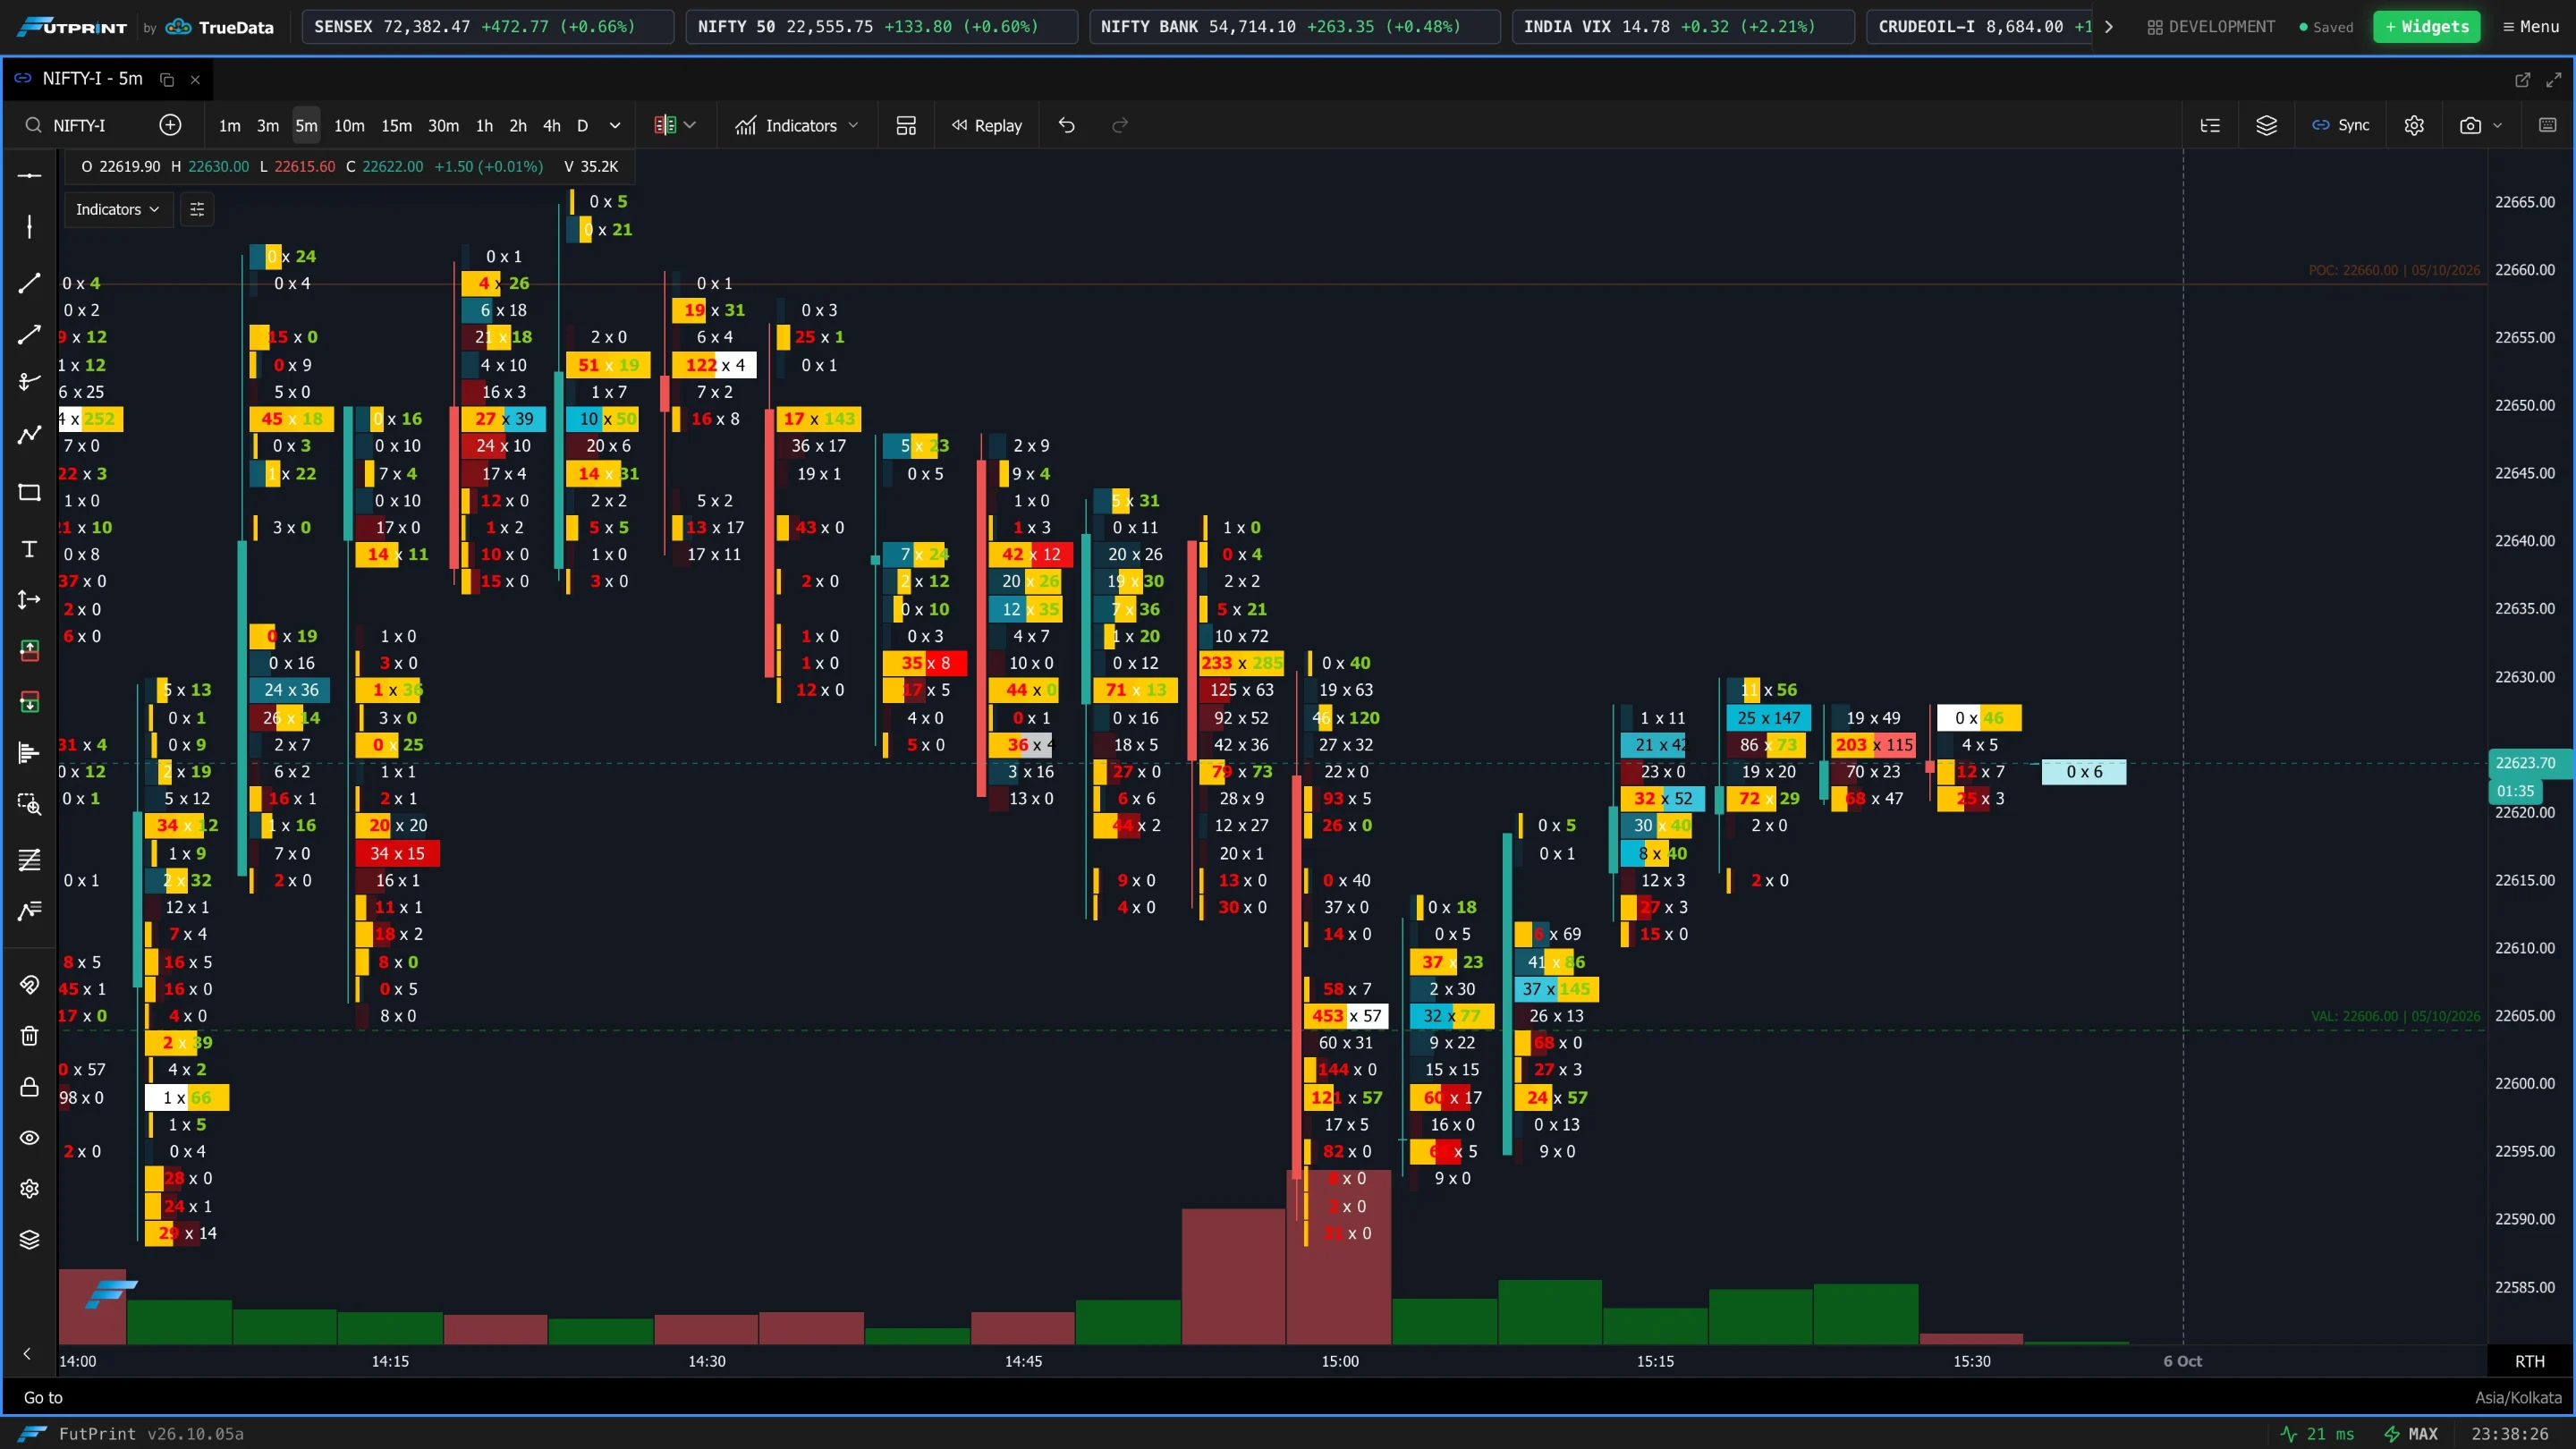
Imbalance Detection
Flags price levels where one side's volume dominates the other.
| Setting | What it does |
|---|---|
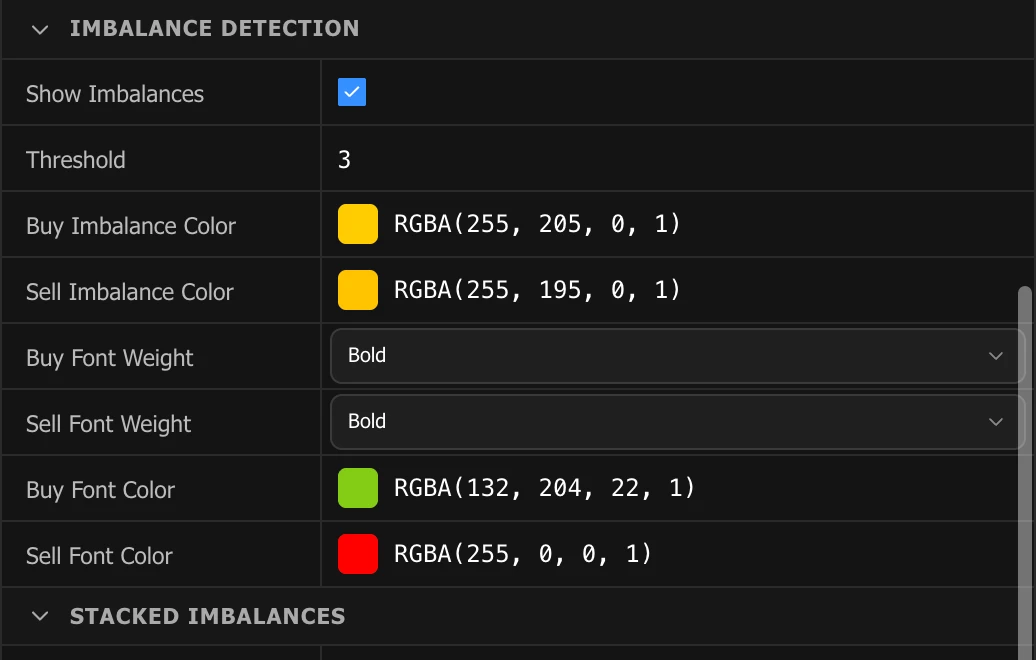
| Show Imbalances | Turn on imbalance highlighting. |
| Threshold | The buy:sell (or sell:buy) ratio required to mark a level as imbalanced. |
| Buy Imbalance Color | Where buying volume strongly exceeds selling. |
| Sell Imbalance Color | Where selling volume strongly exceeds buying. |
| Buy Font Weight / Sell Font Weight | Normal or Bold for the imbalanced price labels. |
| Buy Font Color / Sell Font Color | Text colour of the imbalanced price levels. |
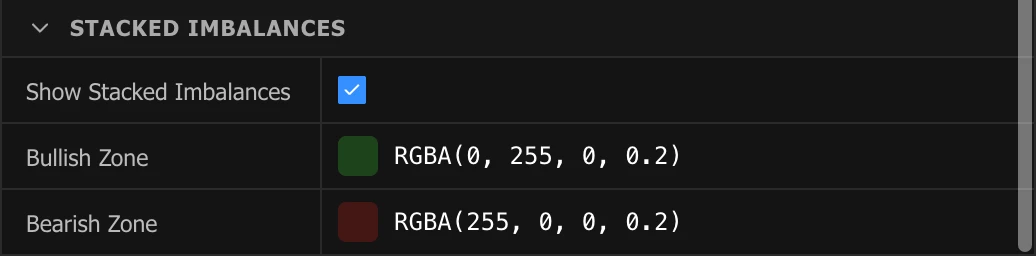
Stacked Imbalances
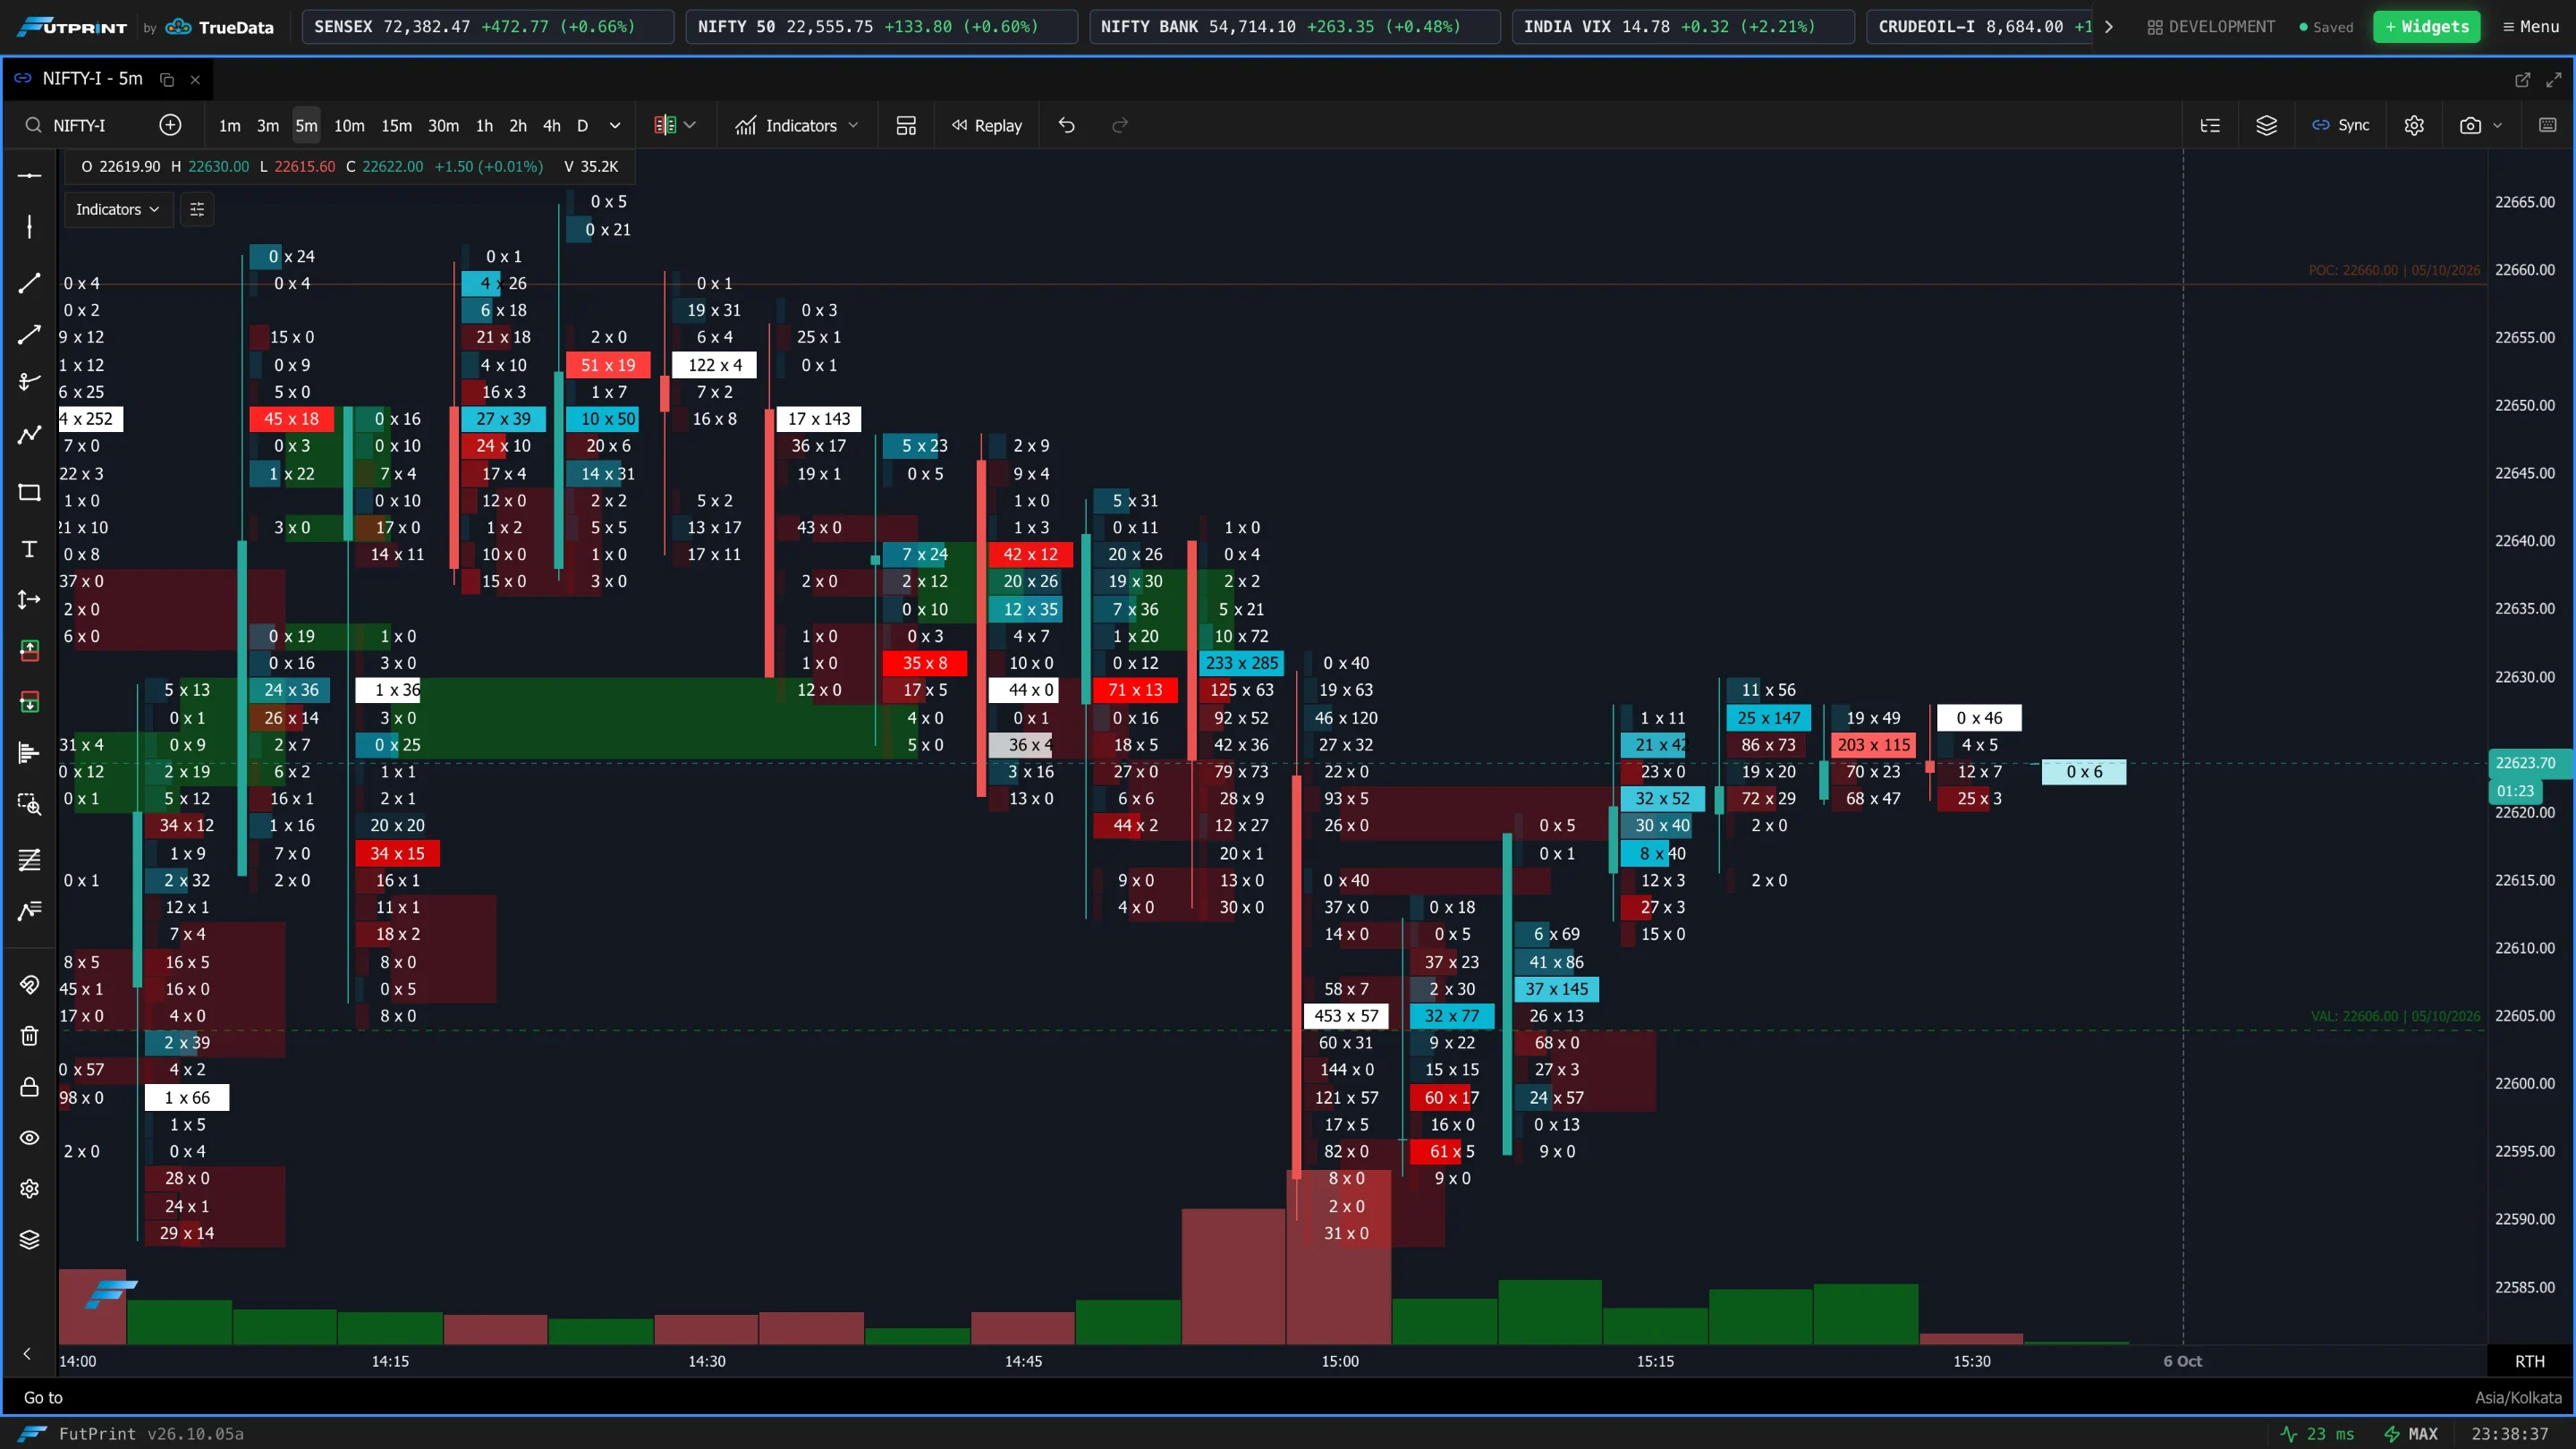
Consecutive imbalances at adjacent levels accumulate into supply/demand zones.
| Setting | What it does |
|---|---|
| Show Stacked Imbalances | Draw stacked-imbalance zones that build up over time. |
| Bullish Zone | Colour for accumulated buying-pressure zones. |
| Bearish Zone | Colour for accumulated selling-pressure zones. |
Bin Size LTP-Based Fixed; Cluster Style Double-sided with left = Sell Volume, right = Buy Volume; turn on vPOC, Value Area and Imbalance Detection; add Delta and CVD to Candle Statistics. That gives you levels, fair value, absorption and net pressure at a glance.