Indicator — Bar Statistics
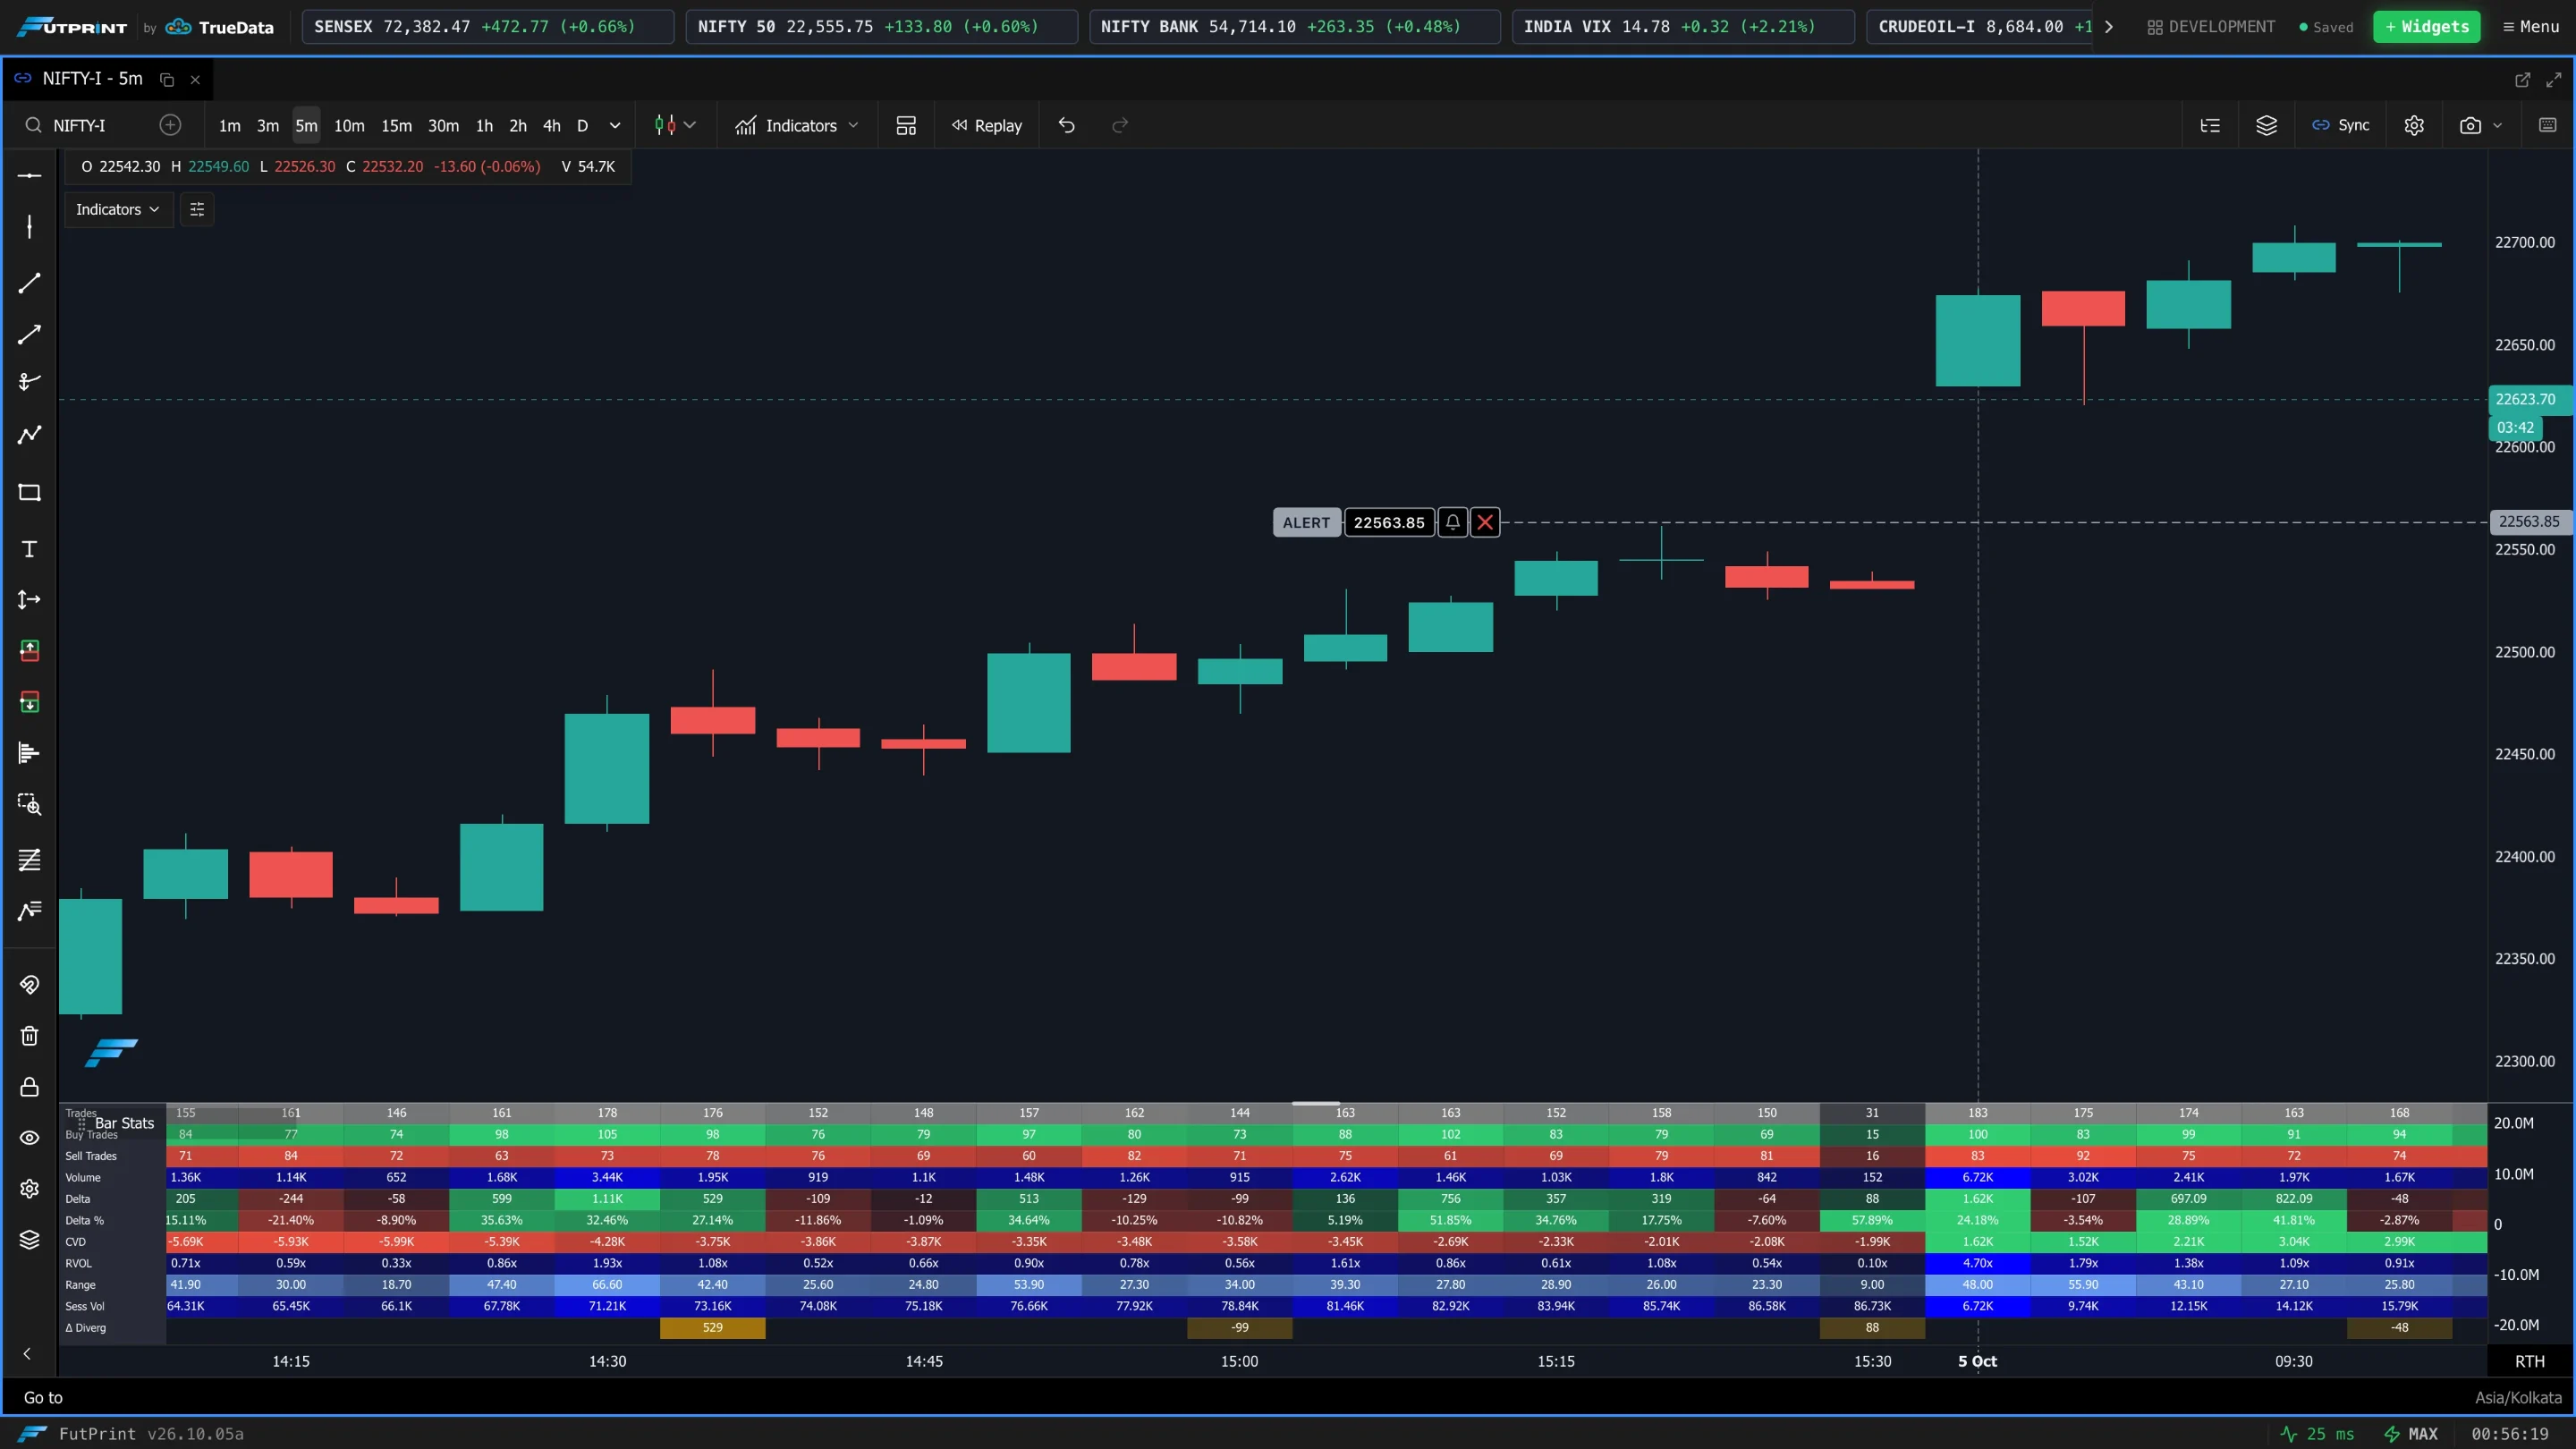
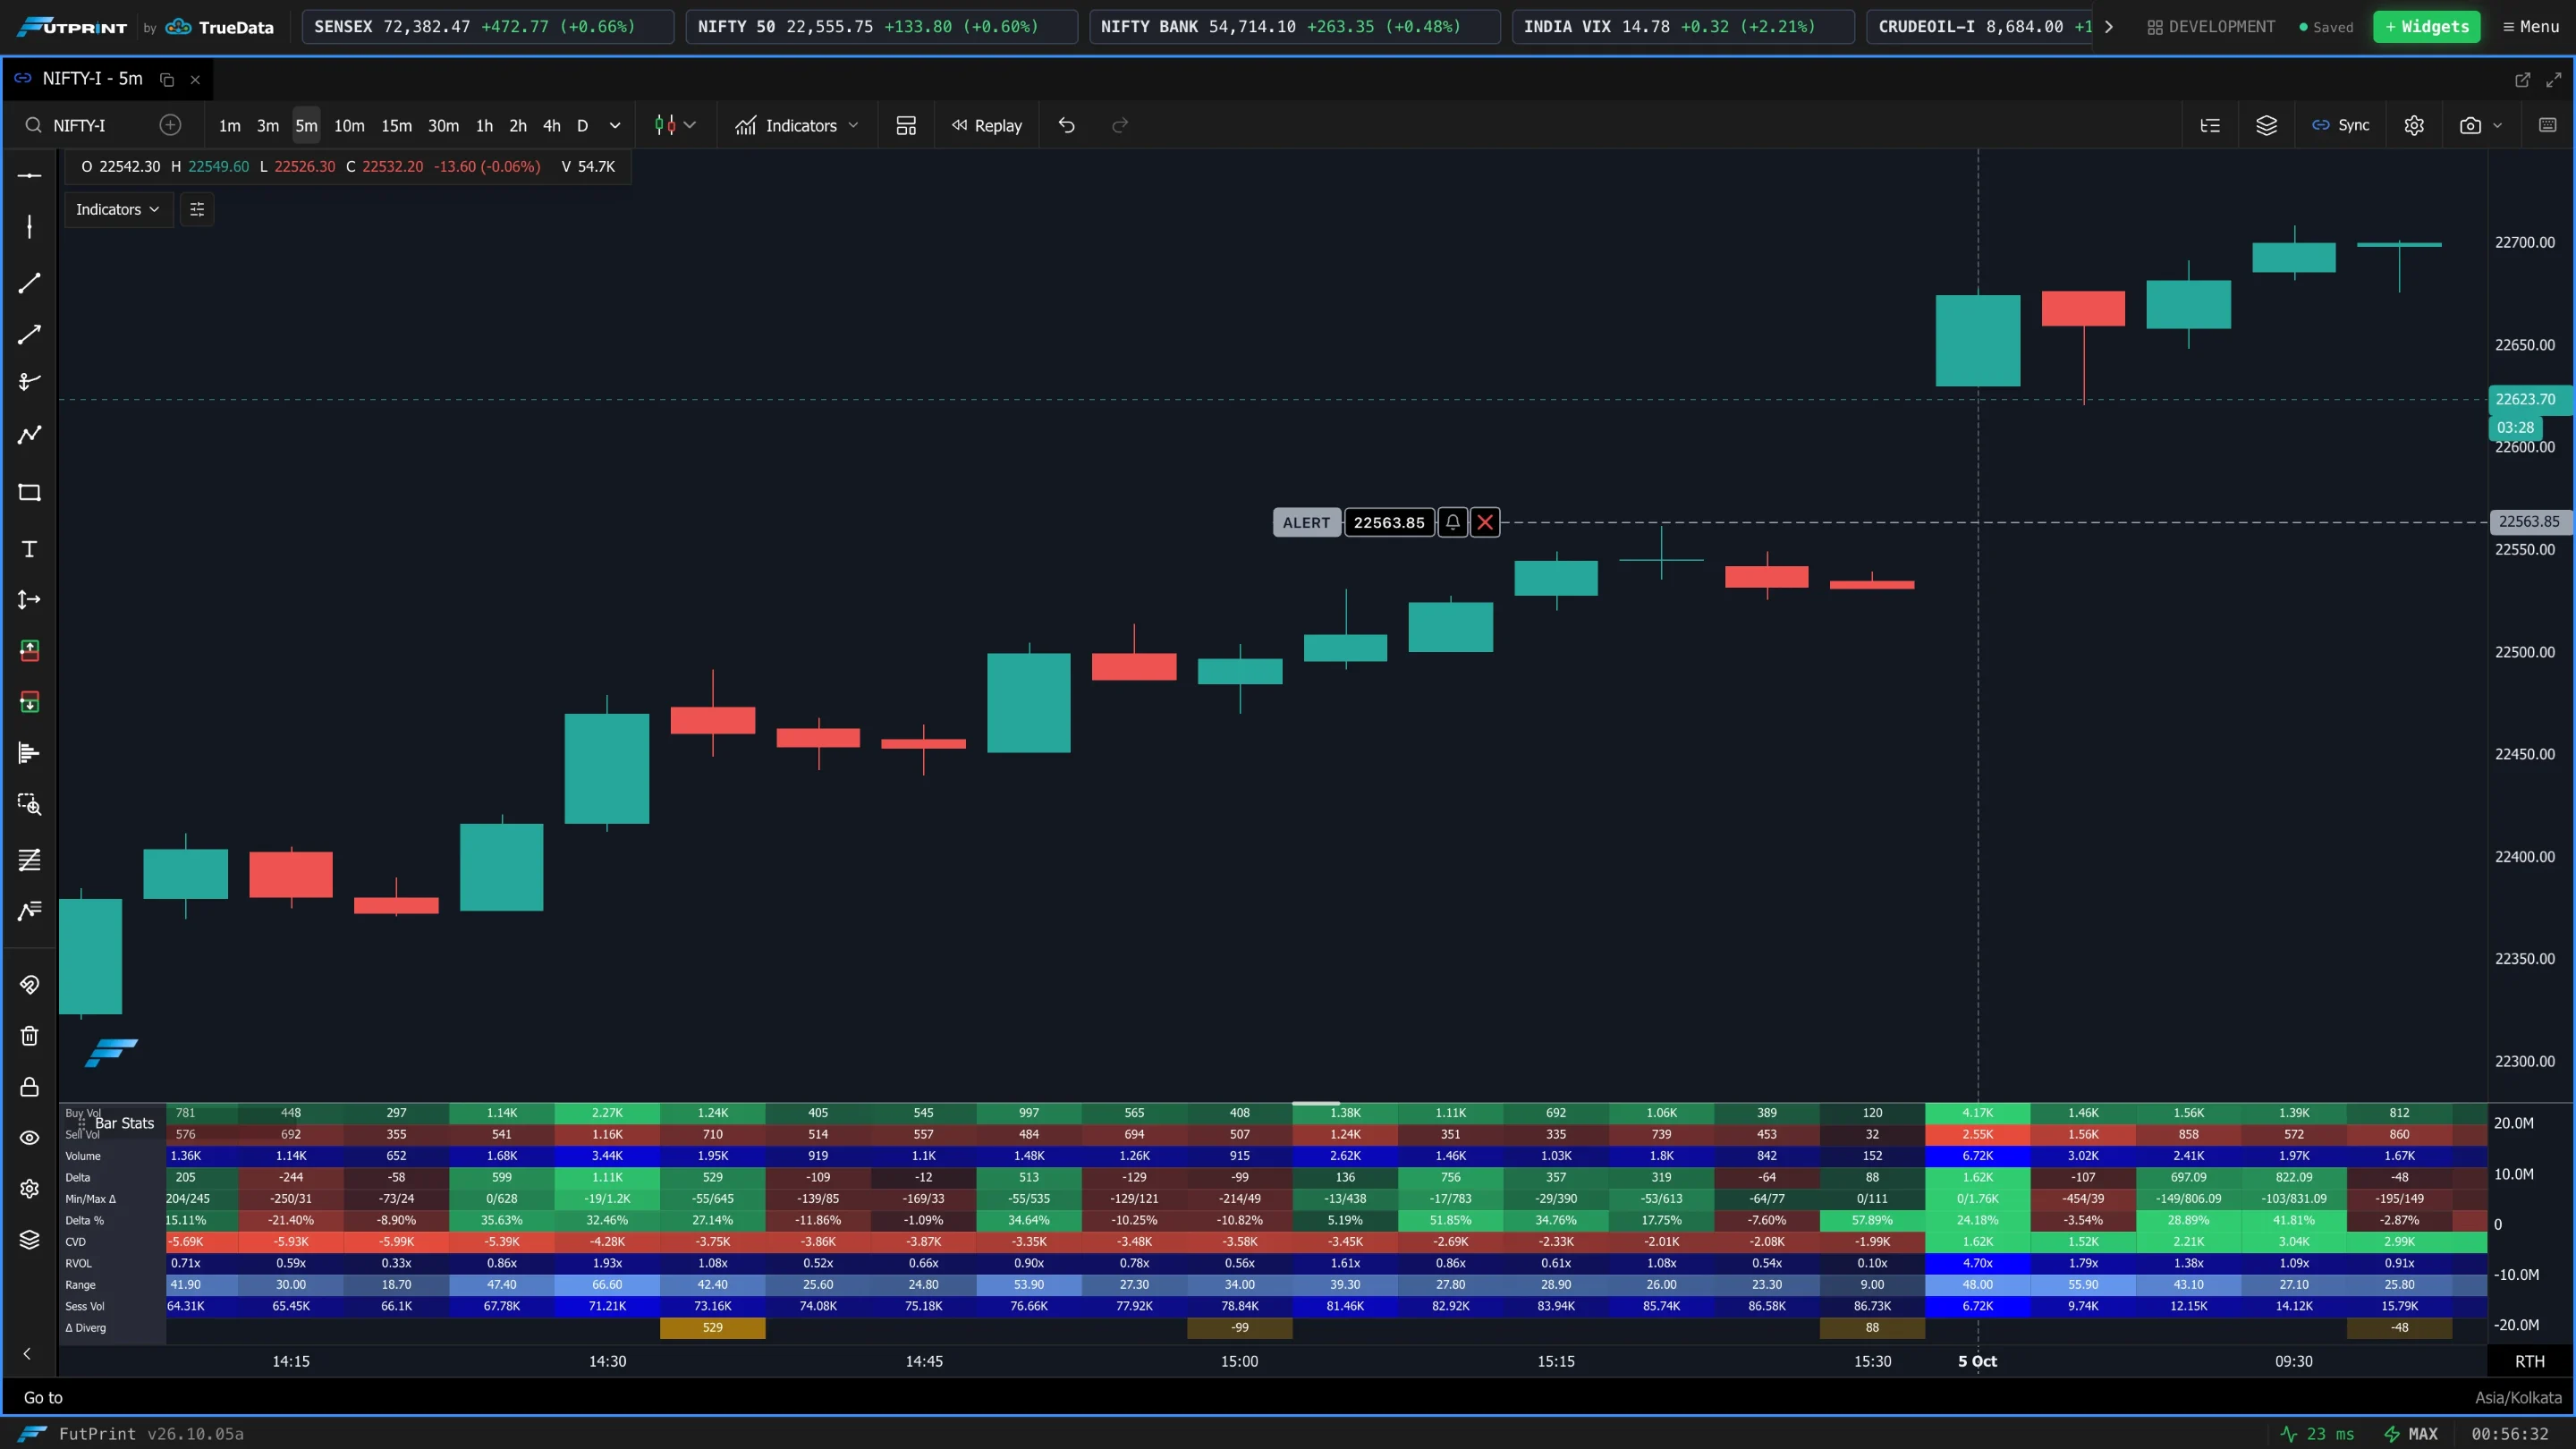
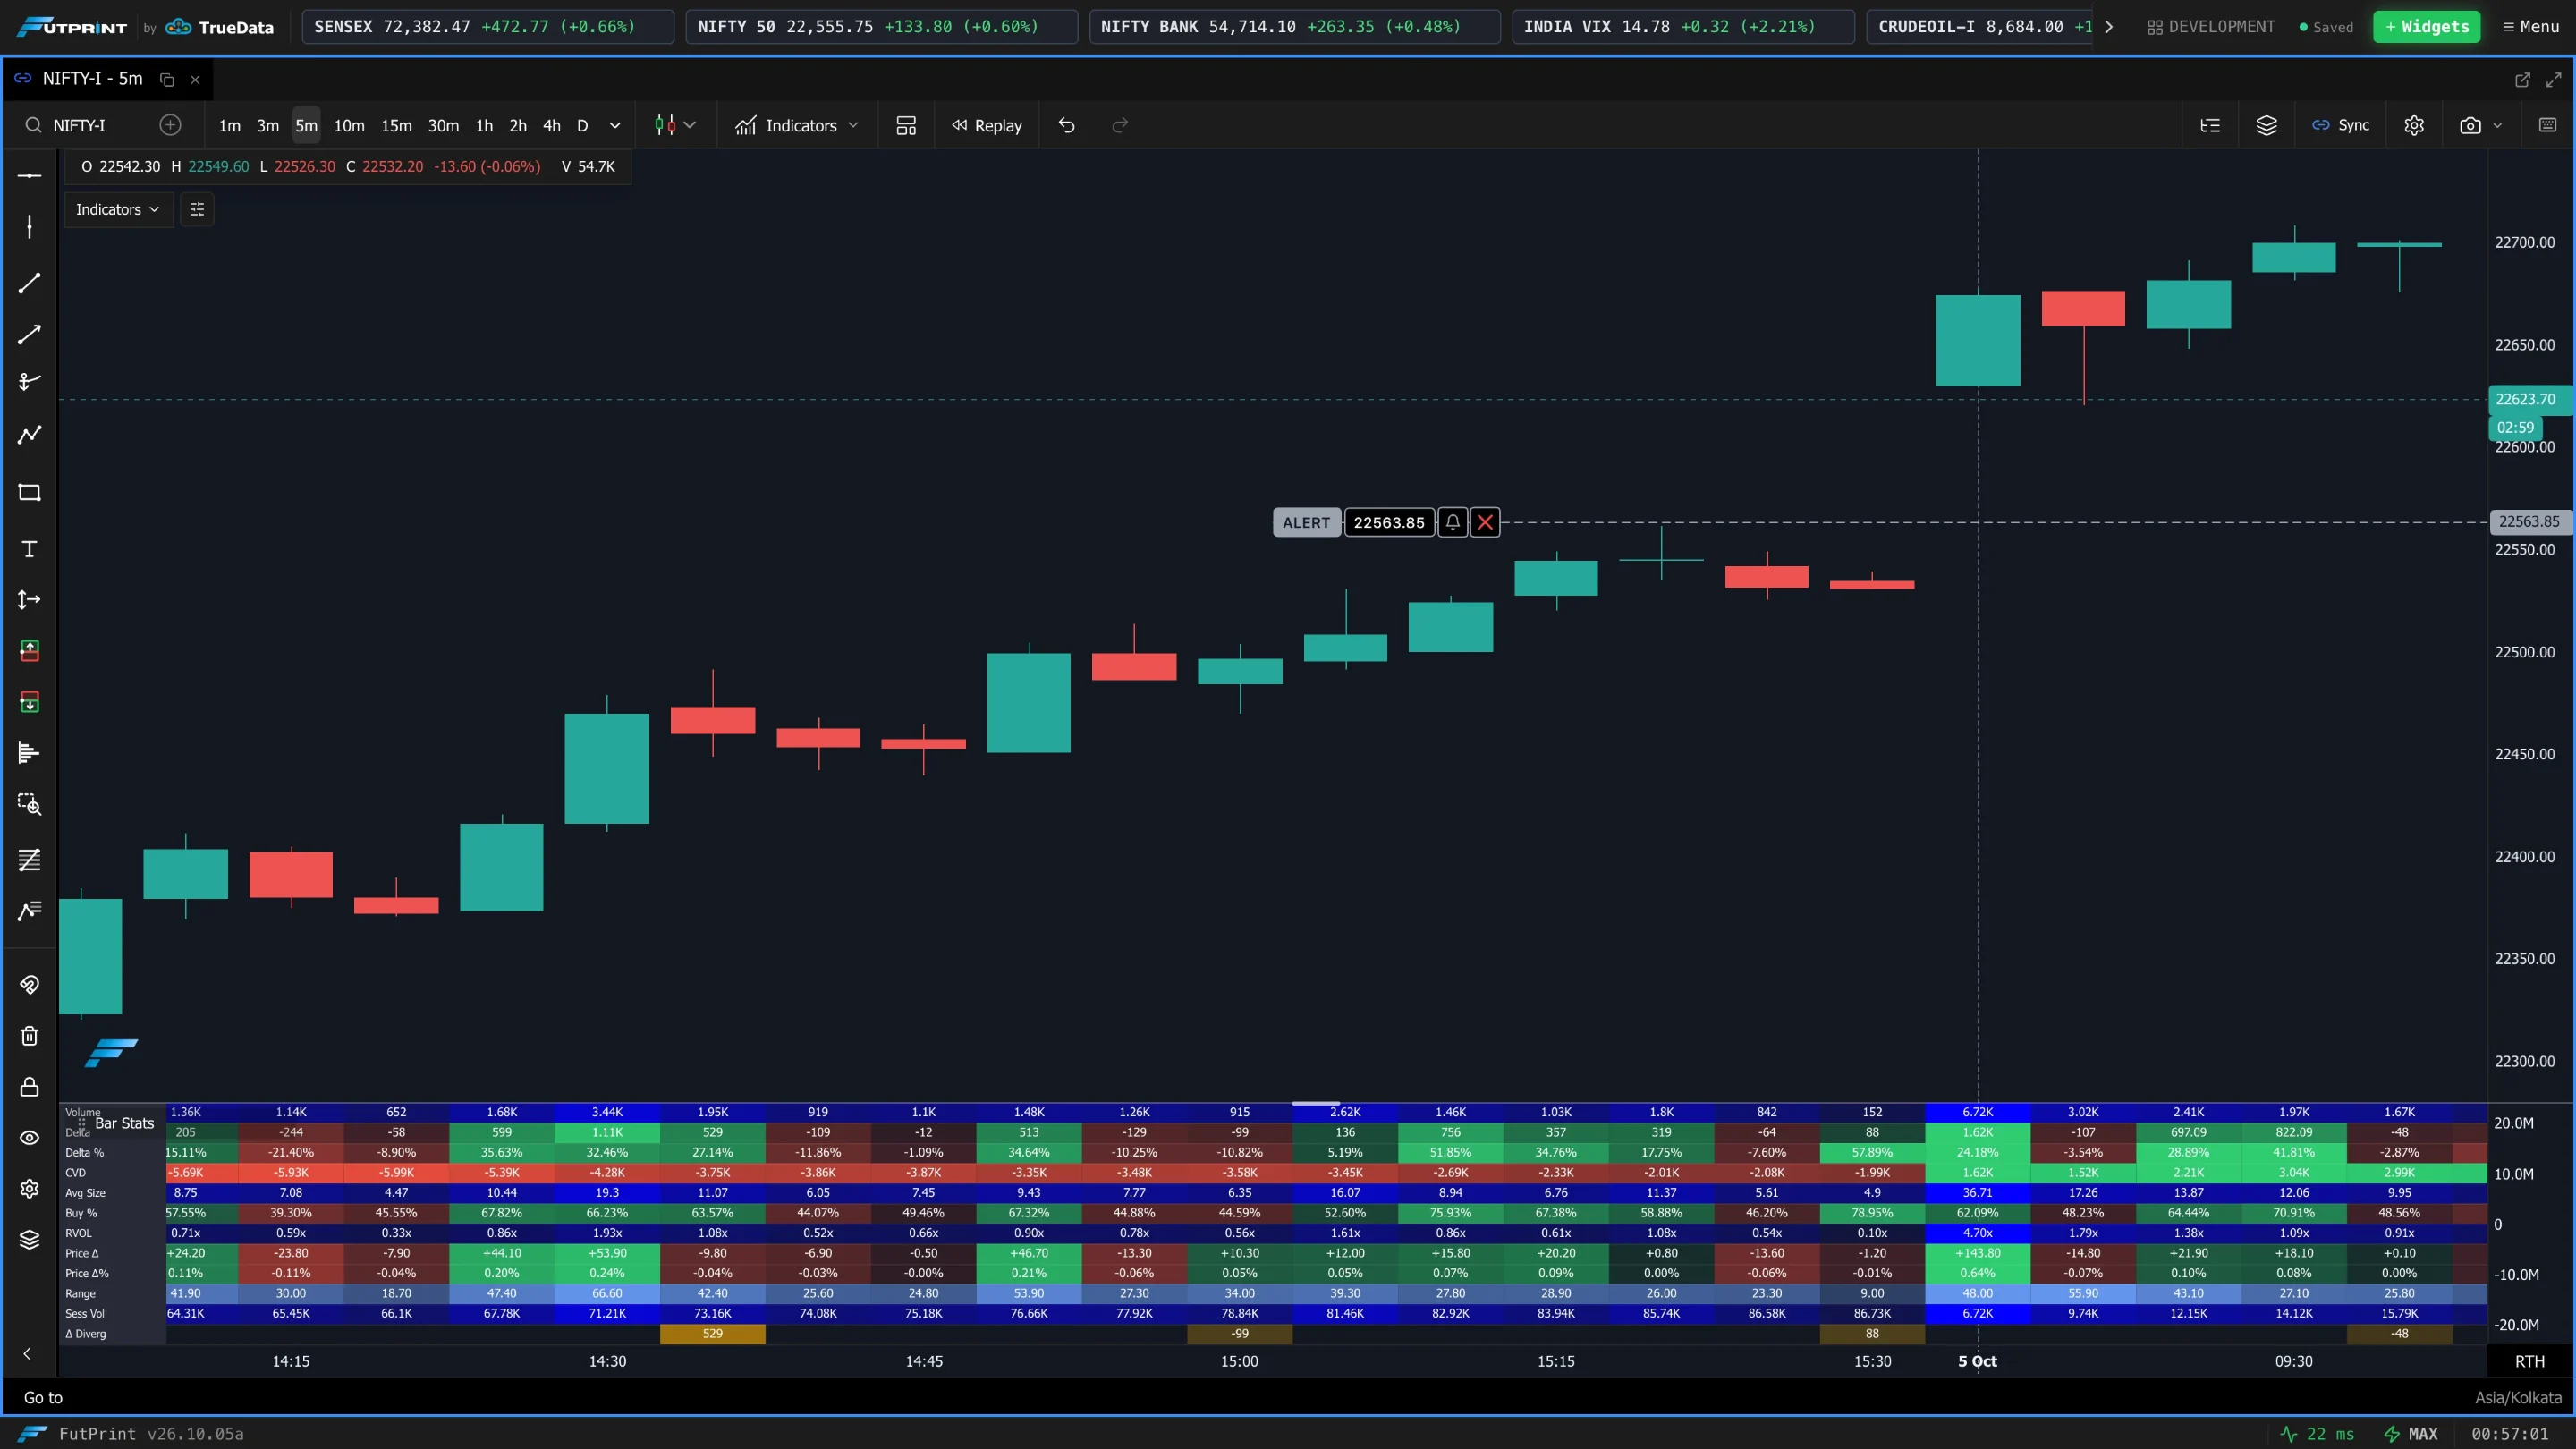
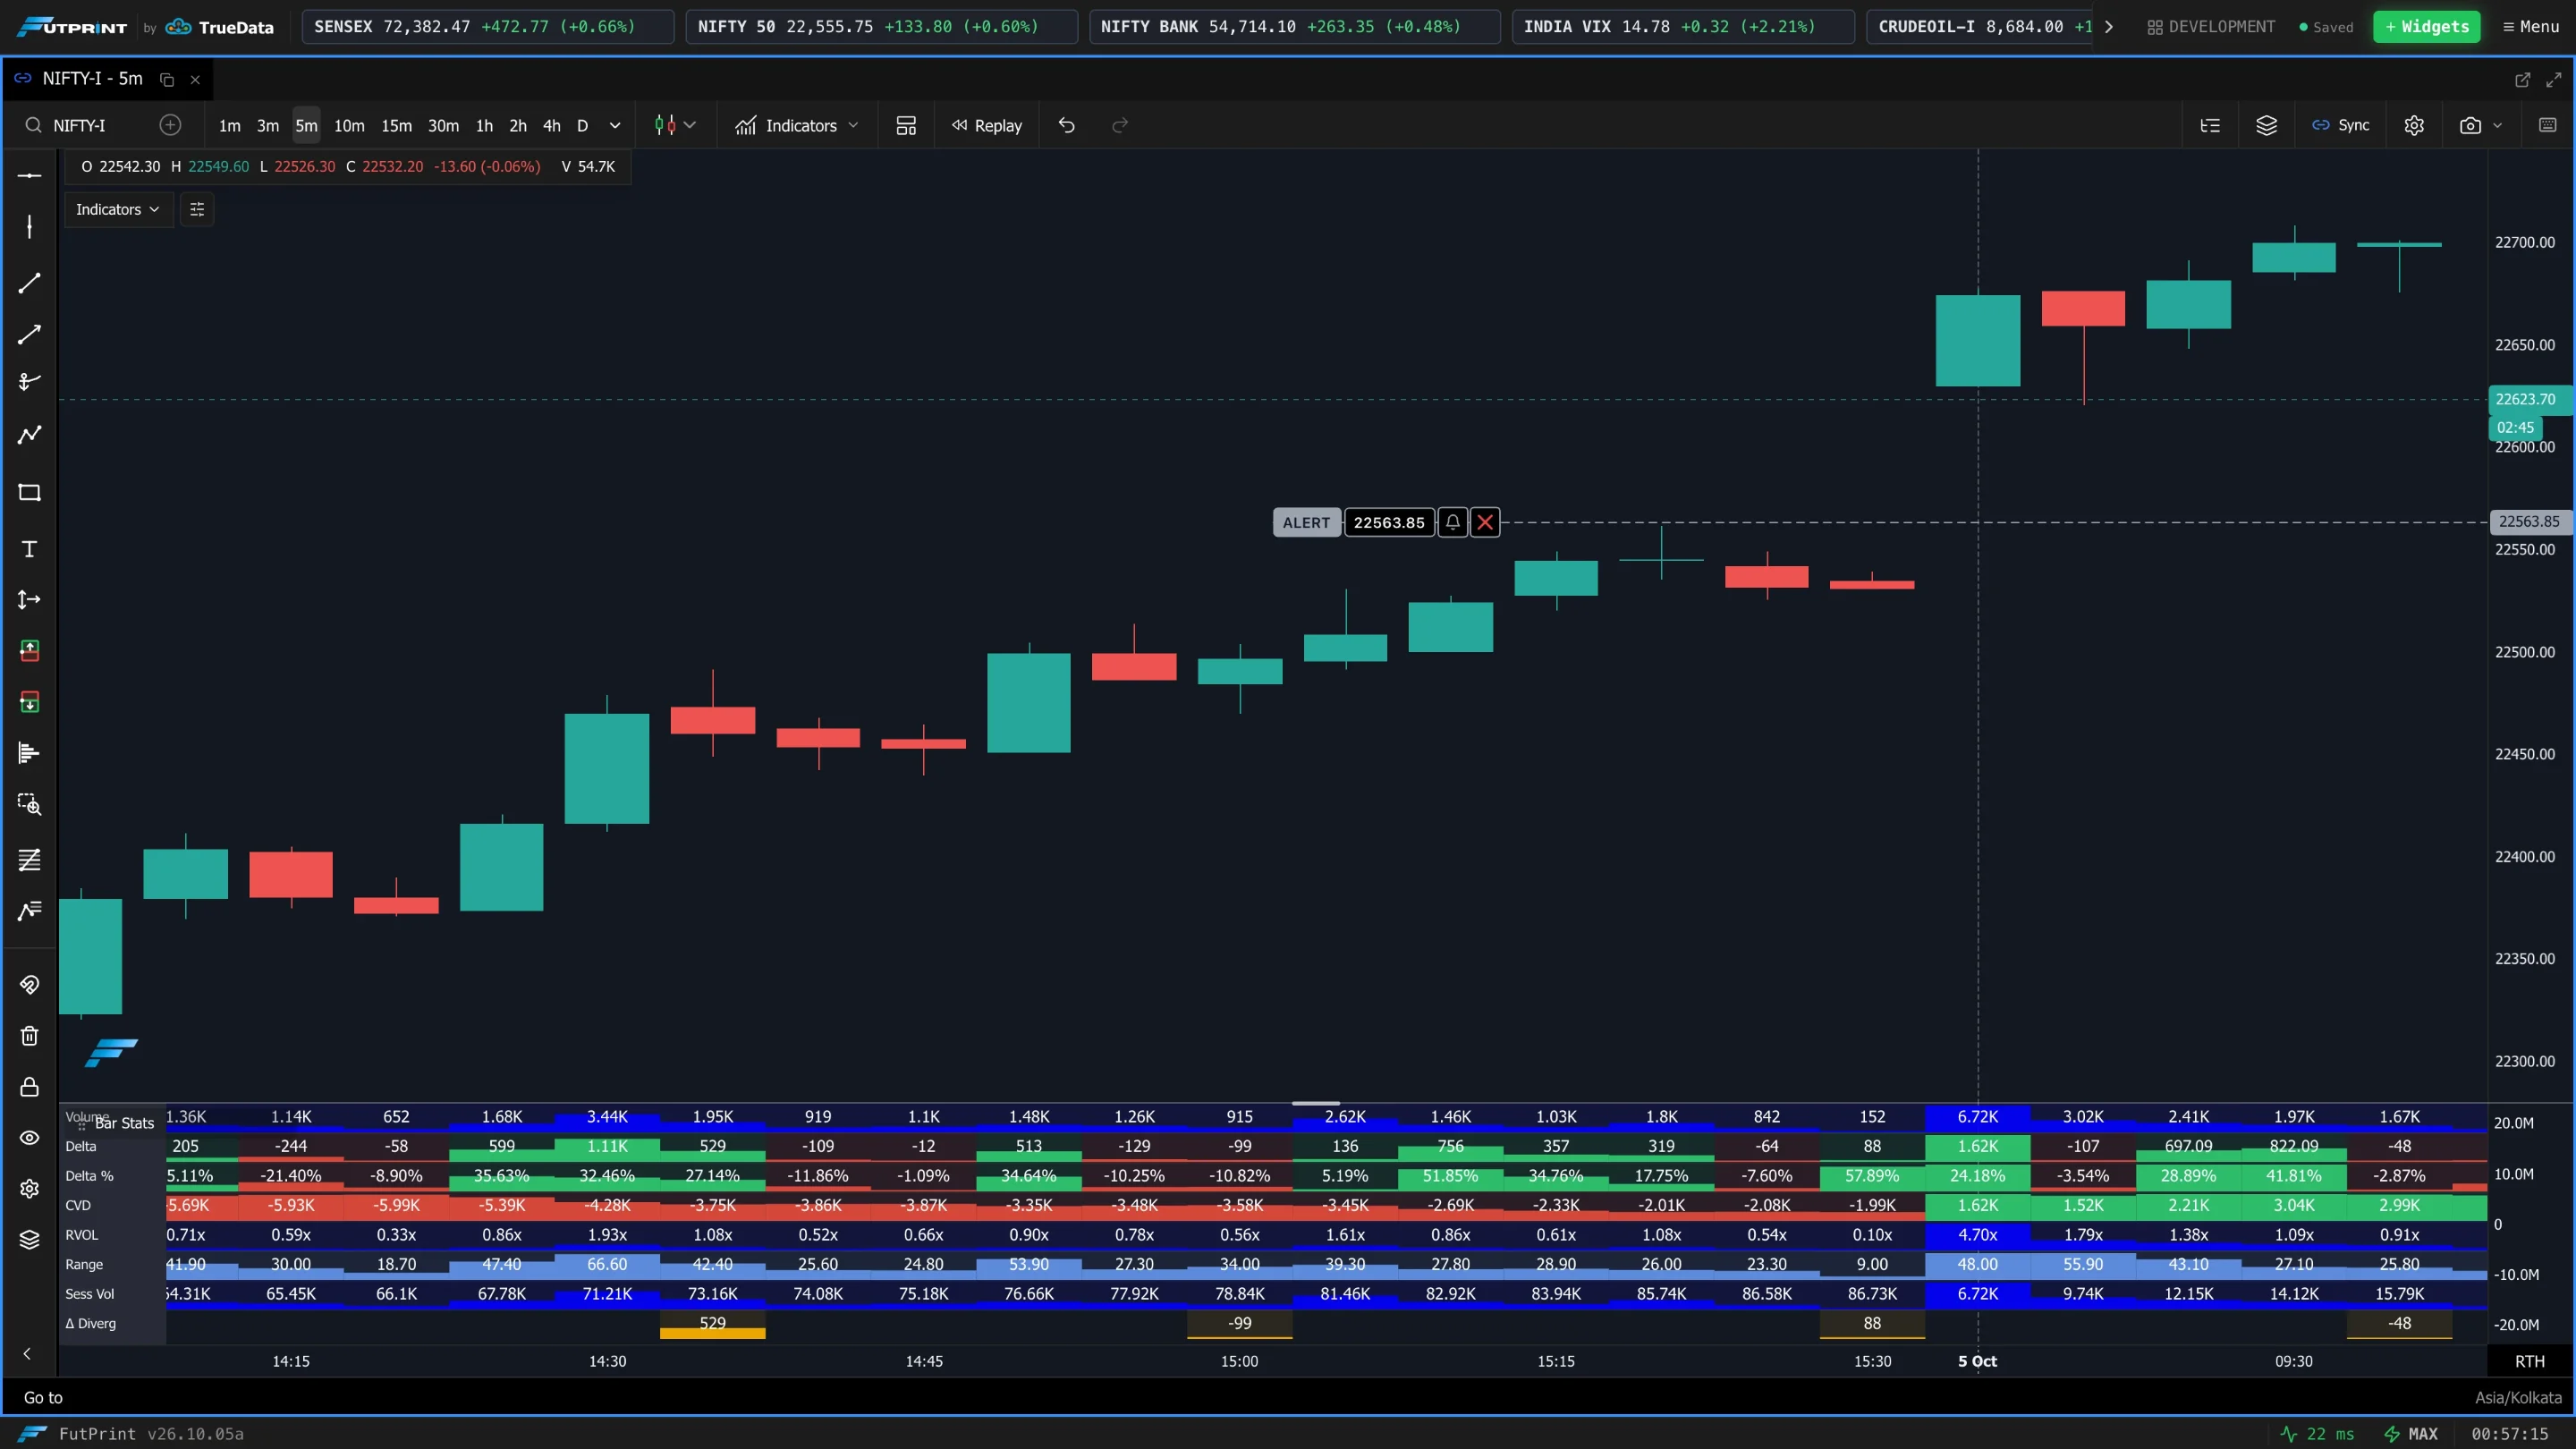
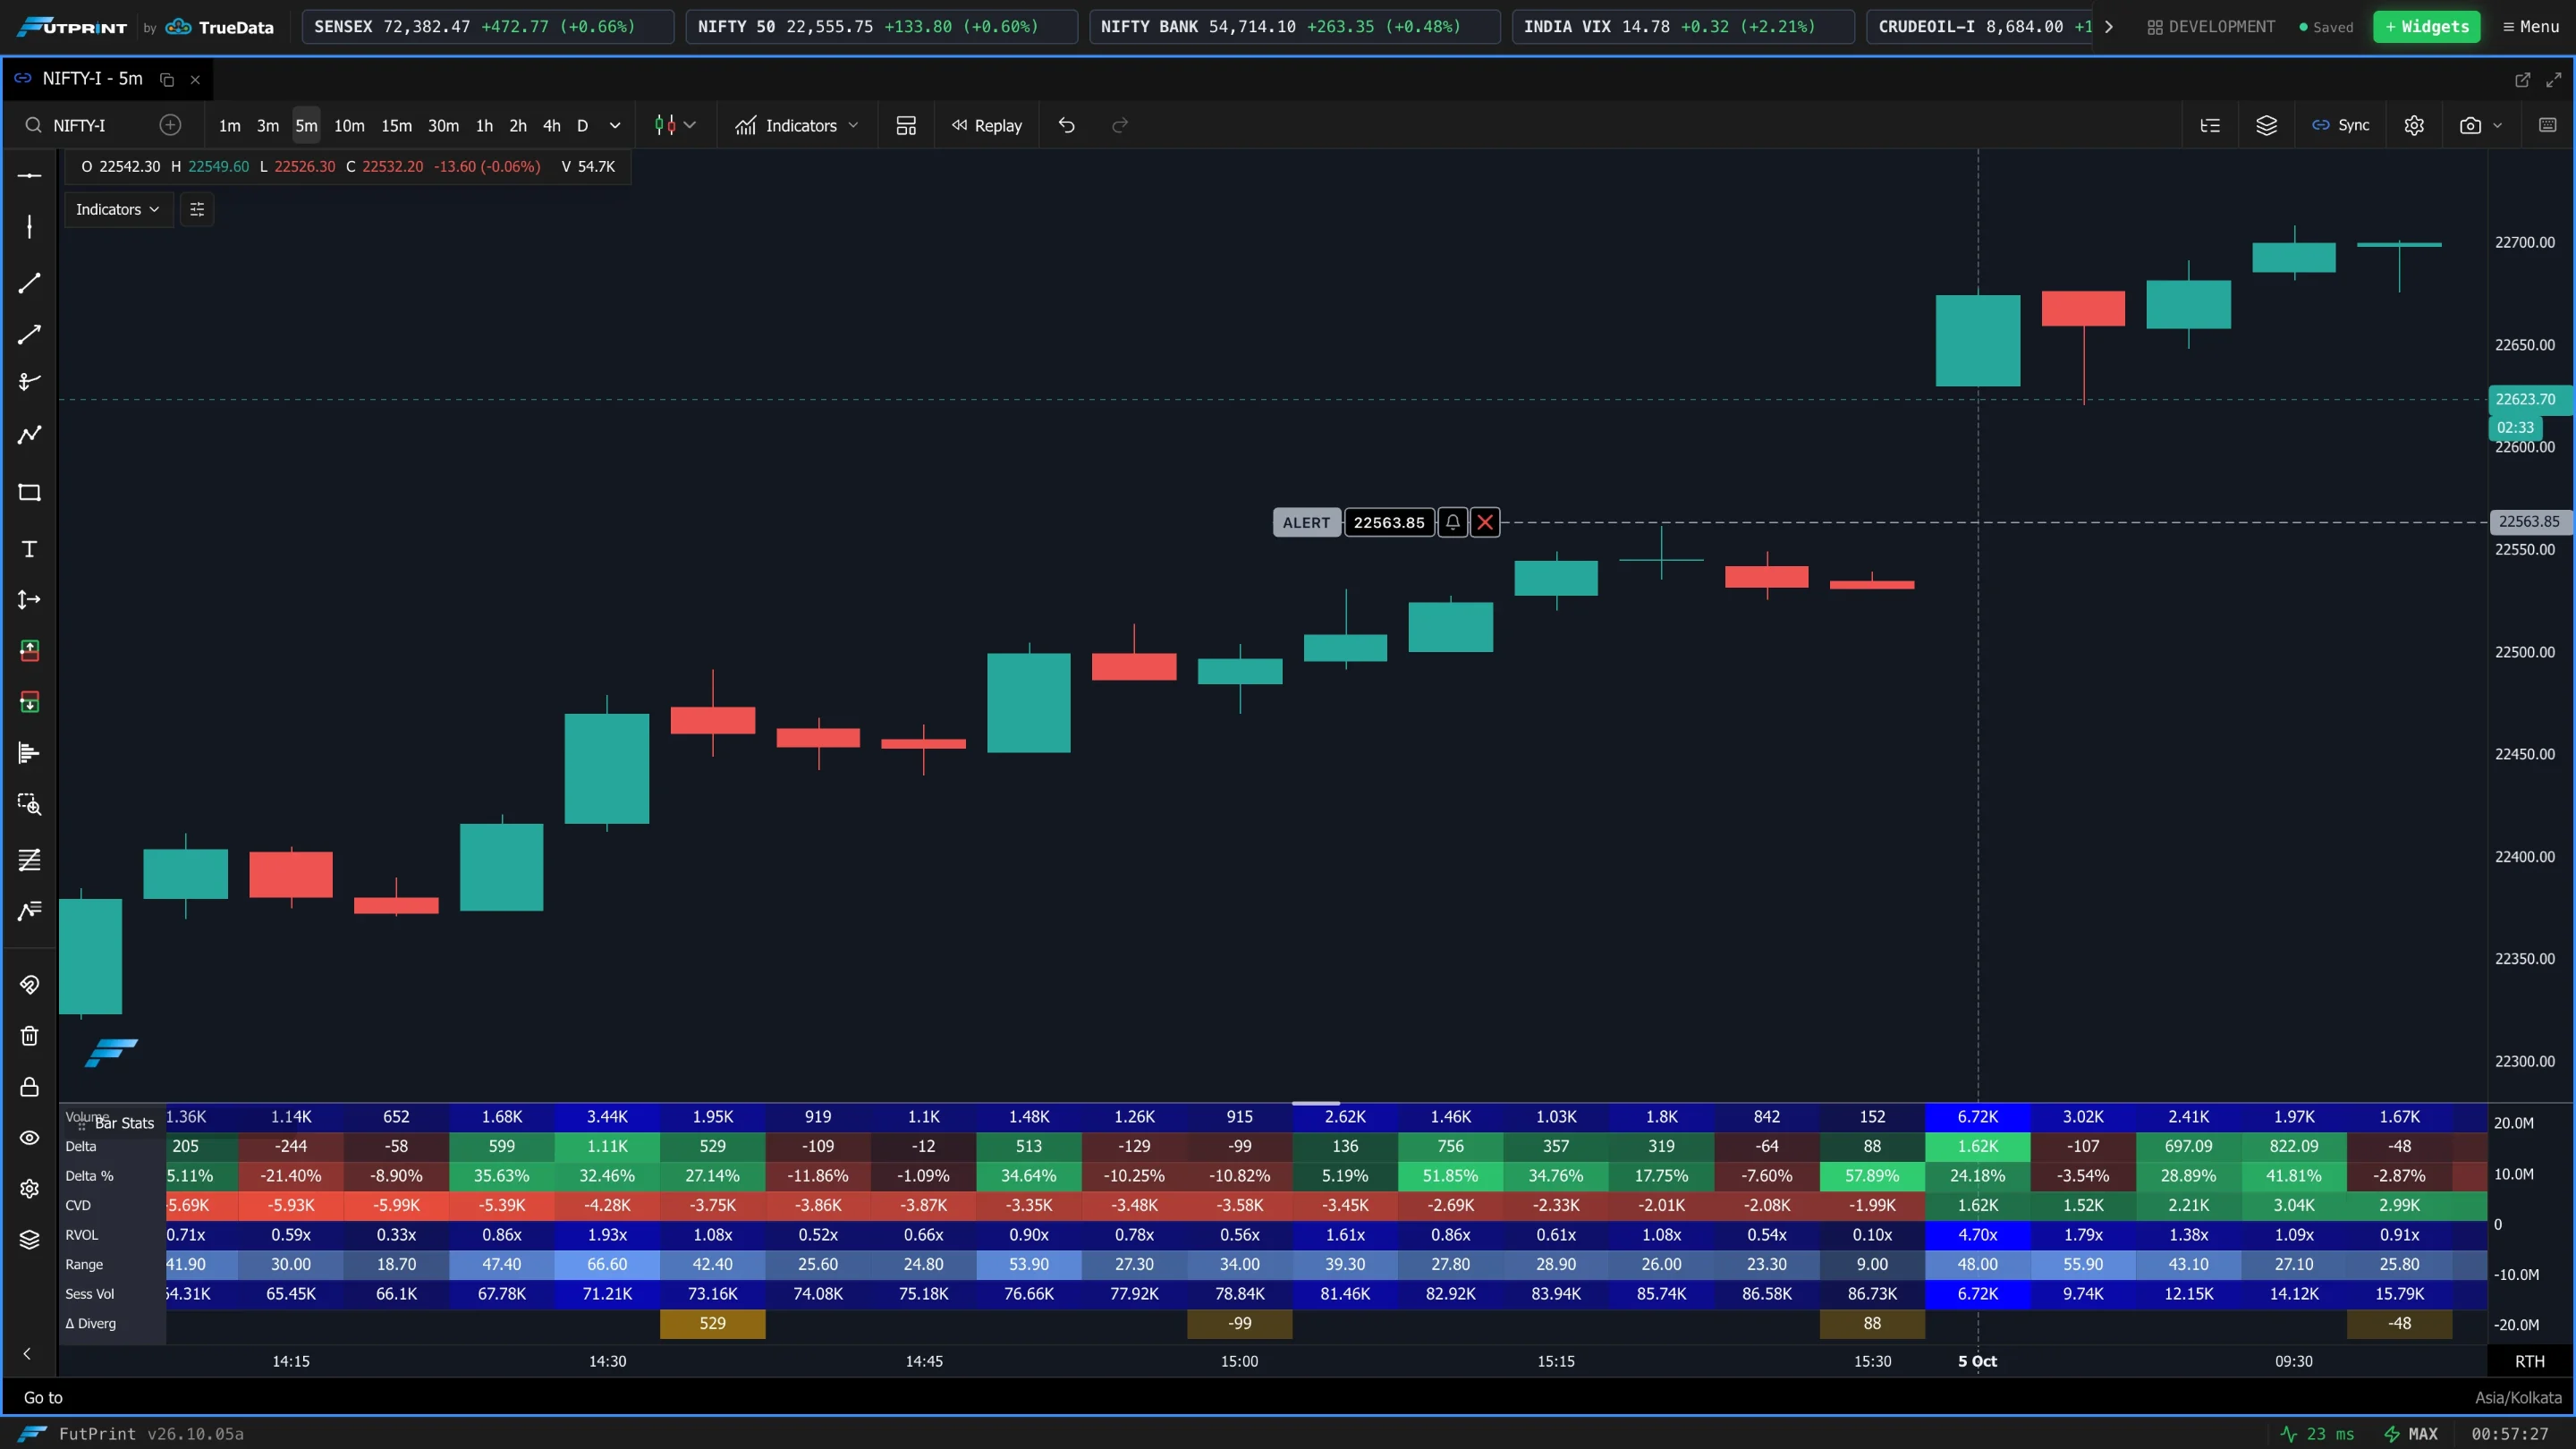
Bar Statistics is a grid under the chart with one column per candle and one row per statistic: volume, delta, cumulative delta, open-interest change and more. Each cell is shaded by its value, so unusual candles stand out before you read a single number.
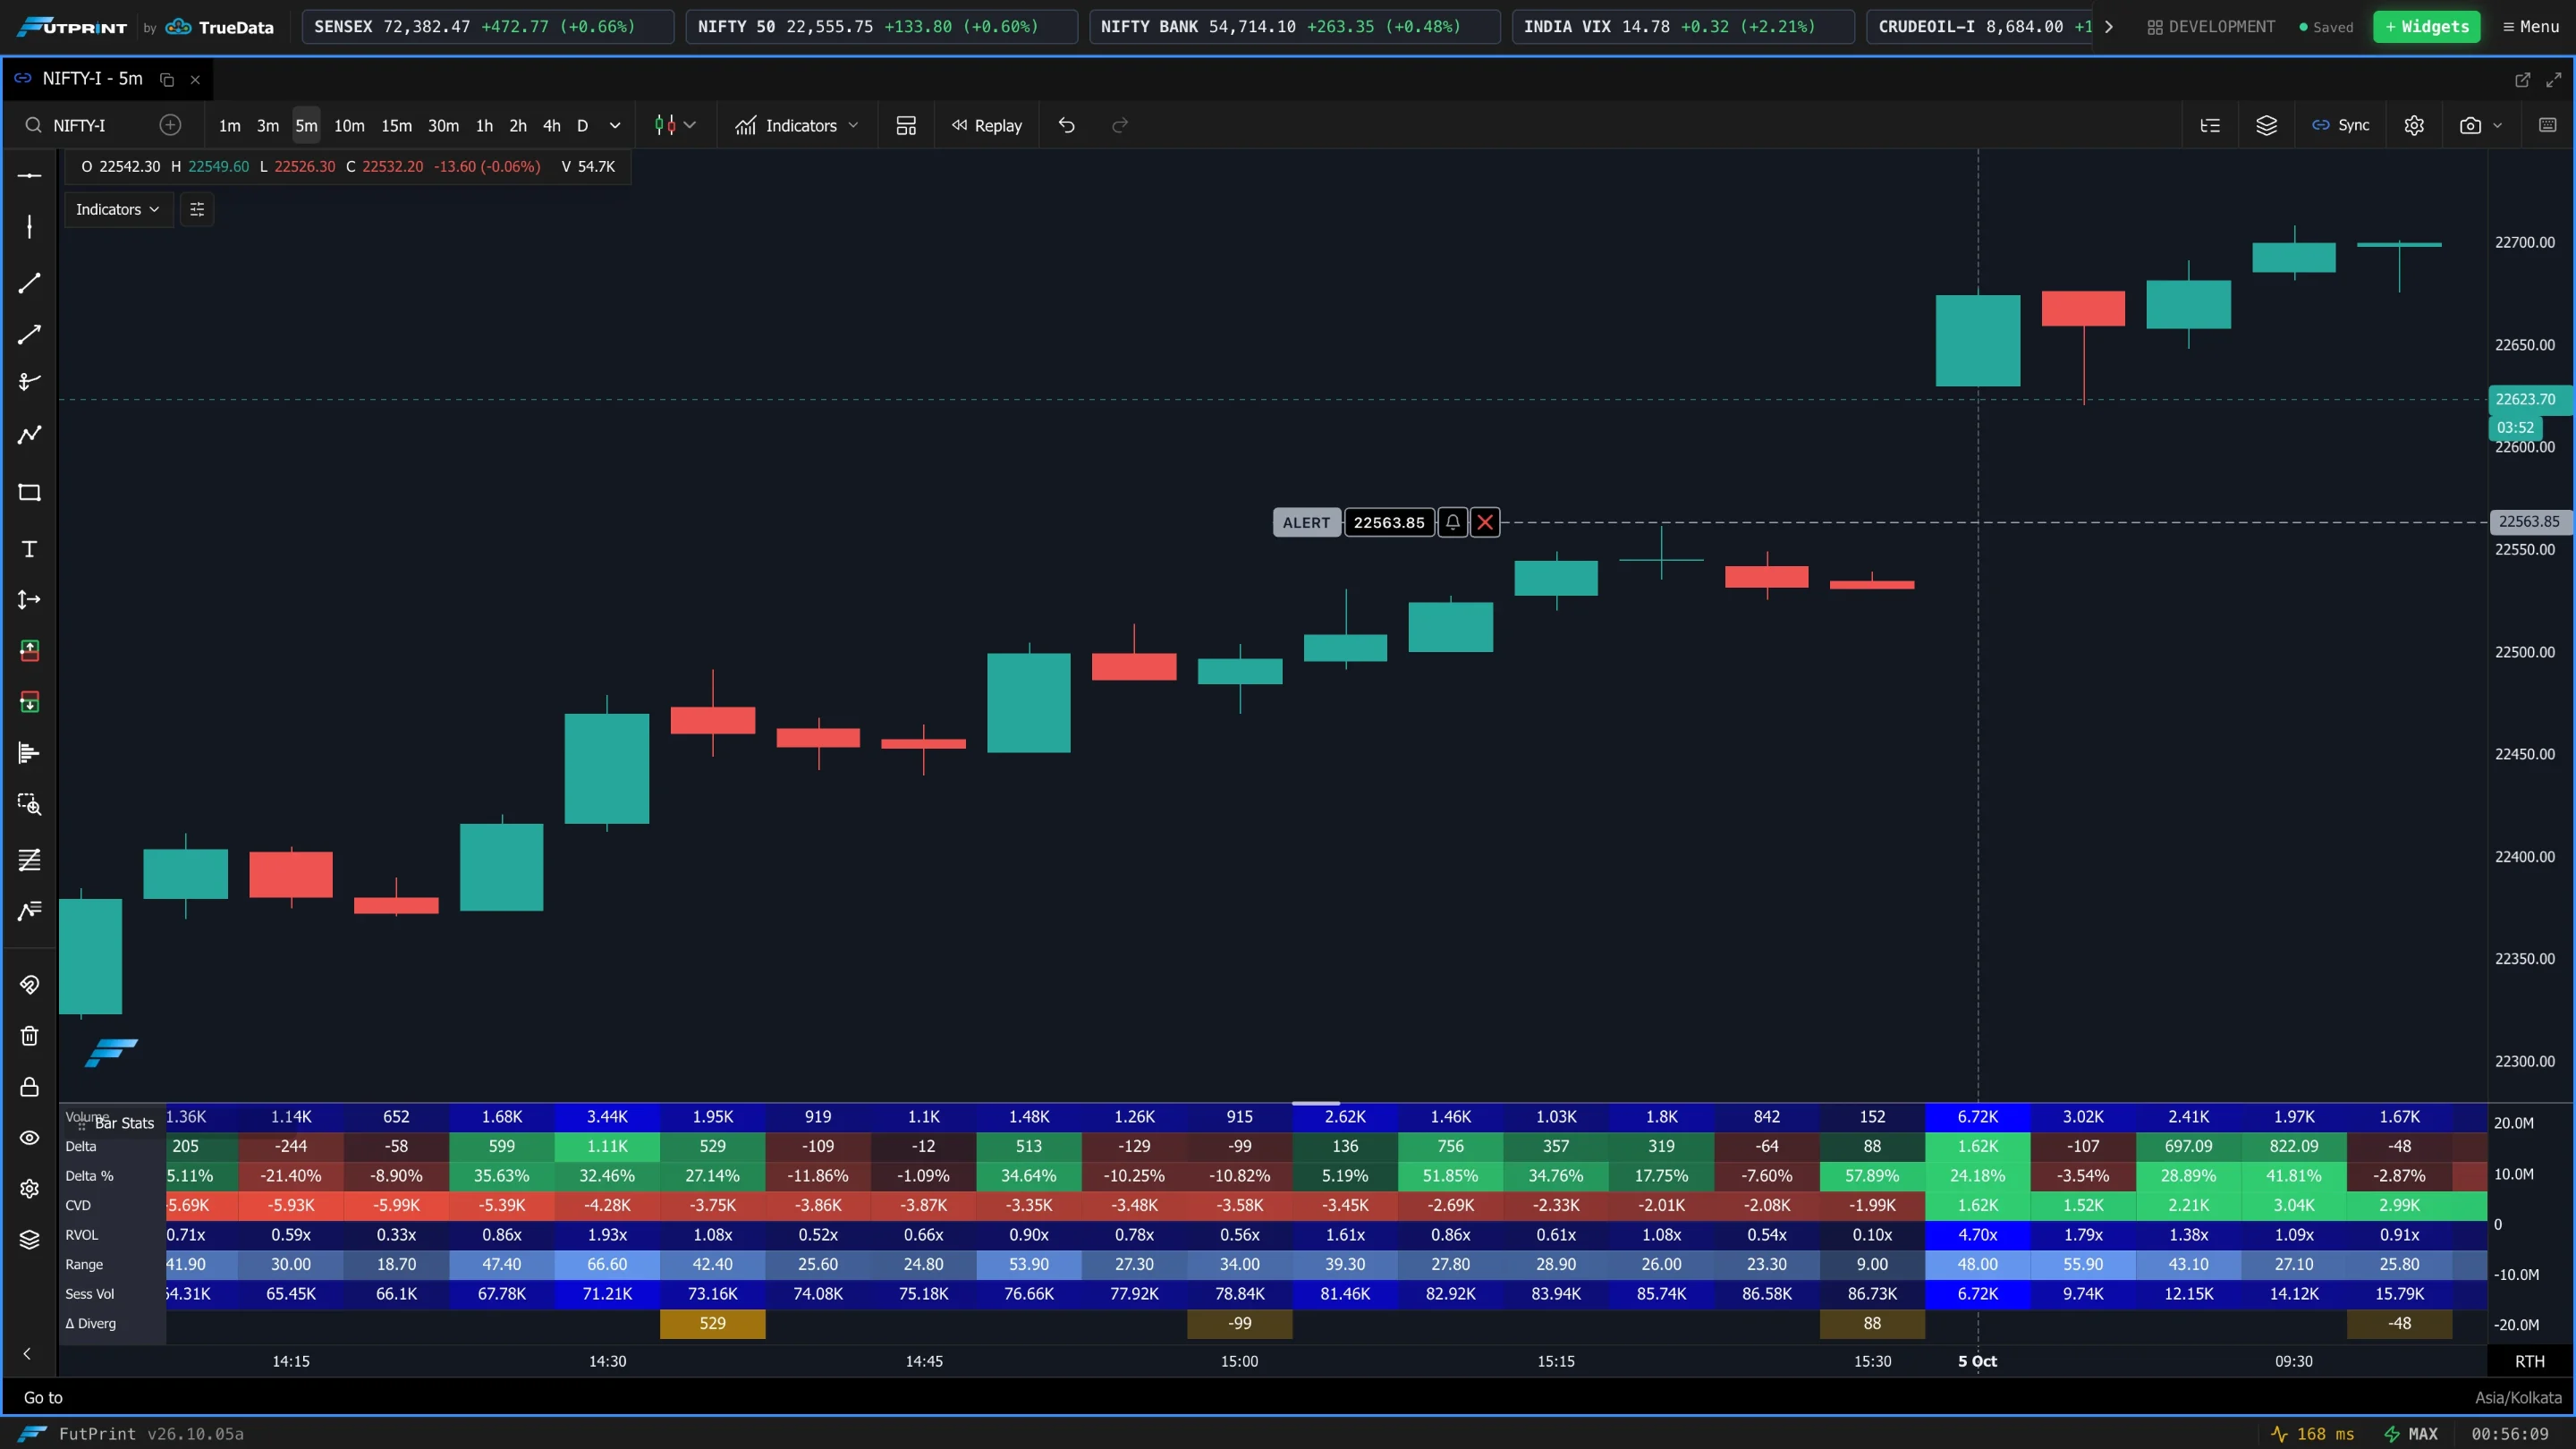
The numbers appear once the candles are wide enough to fit them. Zoomed out, the grid shows colour only and the pane reads Zoom in on X-axis to view bar stats grid.
Opening the settings
Hover the Bar Stats pane title and click Settings. Bar Statistics has its own dialog; press Done to apply, or Reset to defaults to start over.
General Stats
| Setting | Row it adds |
|---|---|
| Show Volume | Total volume of the candle. |
| Show Trades (Count) | Number of trades in the candle. |
| Show Buy Trades / Show Sell Trades | Number of buy-side and sell-side trades. |
| Format Volume | Formats volume numbers with K/M suffixes. |
| Lot Size | Lot size used when formatting volume. |
Delta & Volume Stats
| Setting | Row it adds |
|---|---|
| Show Buy Volume / Show Sell Volume | Buy-side and sell-side volume. |
| Show Delta (Buy - Sell) | Net of the two: positive when buyers were the aggressors. |
| Show Min/Max Delta (Intra-bar) | The lowest and highest delta reached inside the candle. |
| Show Delta % | Delta as a percentage of the candle's volume. |
| Show Cumulative Volume Delta (CVD) | Running total of delta. |
CVD Settings
CVD Reset Period (shown when CVD is on) — Session (Intraday), Daily or Weekly. The CVD row restarts from zero at the start of each period.
Open Interest (OI) Stats
| Setting | Row it adds |
|---|---|
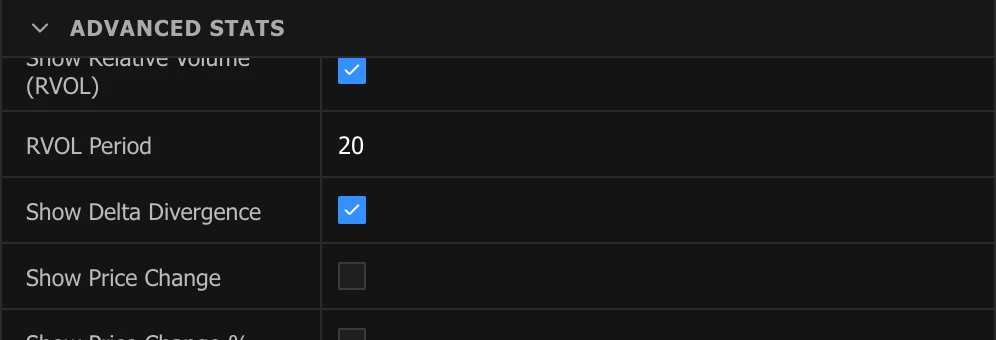
| Show OI Change | Change in open interest during the candle. |
| Show OI Change % | The same as a percentage. |
| Show OI Daily Change | Change in open interest since the start of the day. |
| Show OI Build-up | A label combining price and OI direction (see below). |
| Build-up | Price | OI |
|---|---|---|
| Long Buildup | Up | Up |
| Short Buildup | Down | Up |
| Short Covering | Up | Down |
| Long Unwinding | Down | Down |
Advanced Stats
| Setting | Row it adds |
|---|---|
| Show Avg Trade Size | Average quantity per trade. |
| Show Buy % | Buy volume as a share of total volume. |
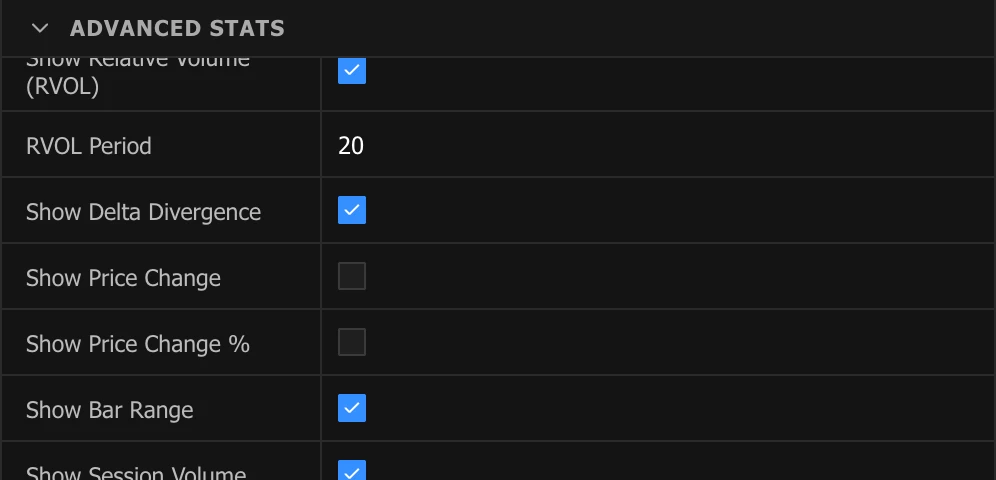
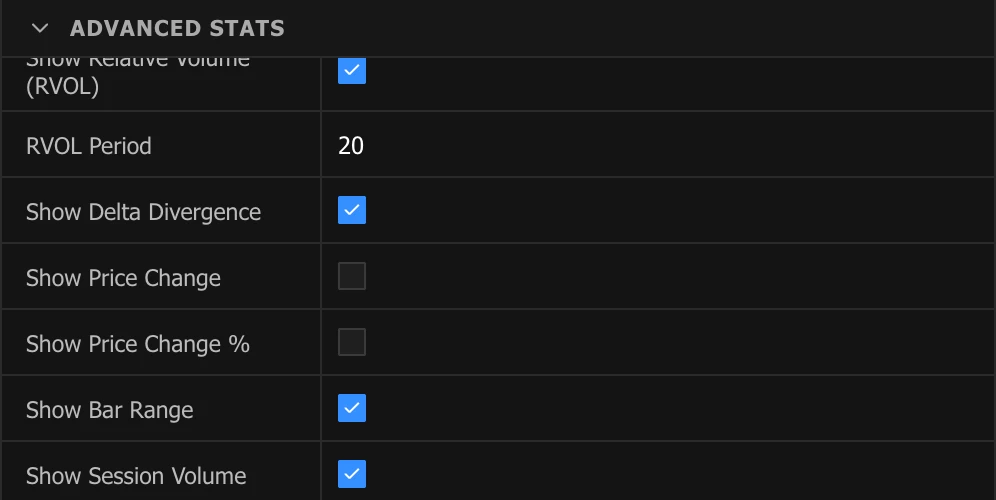
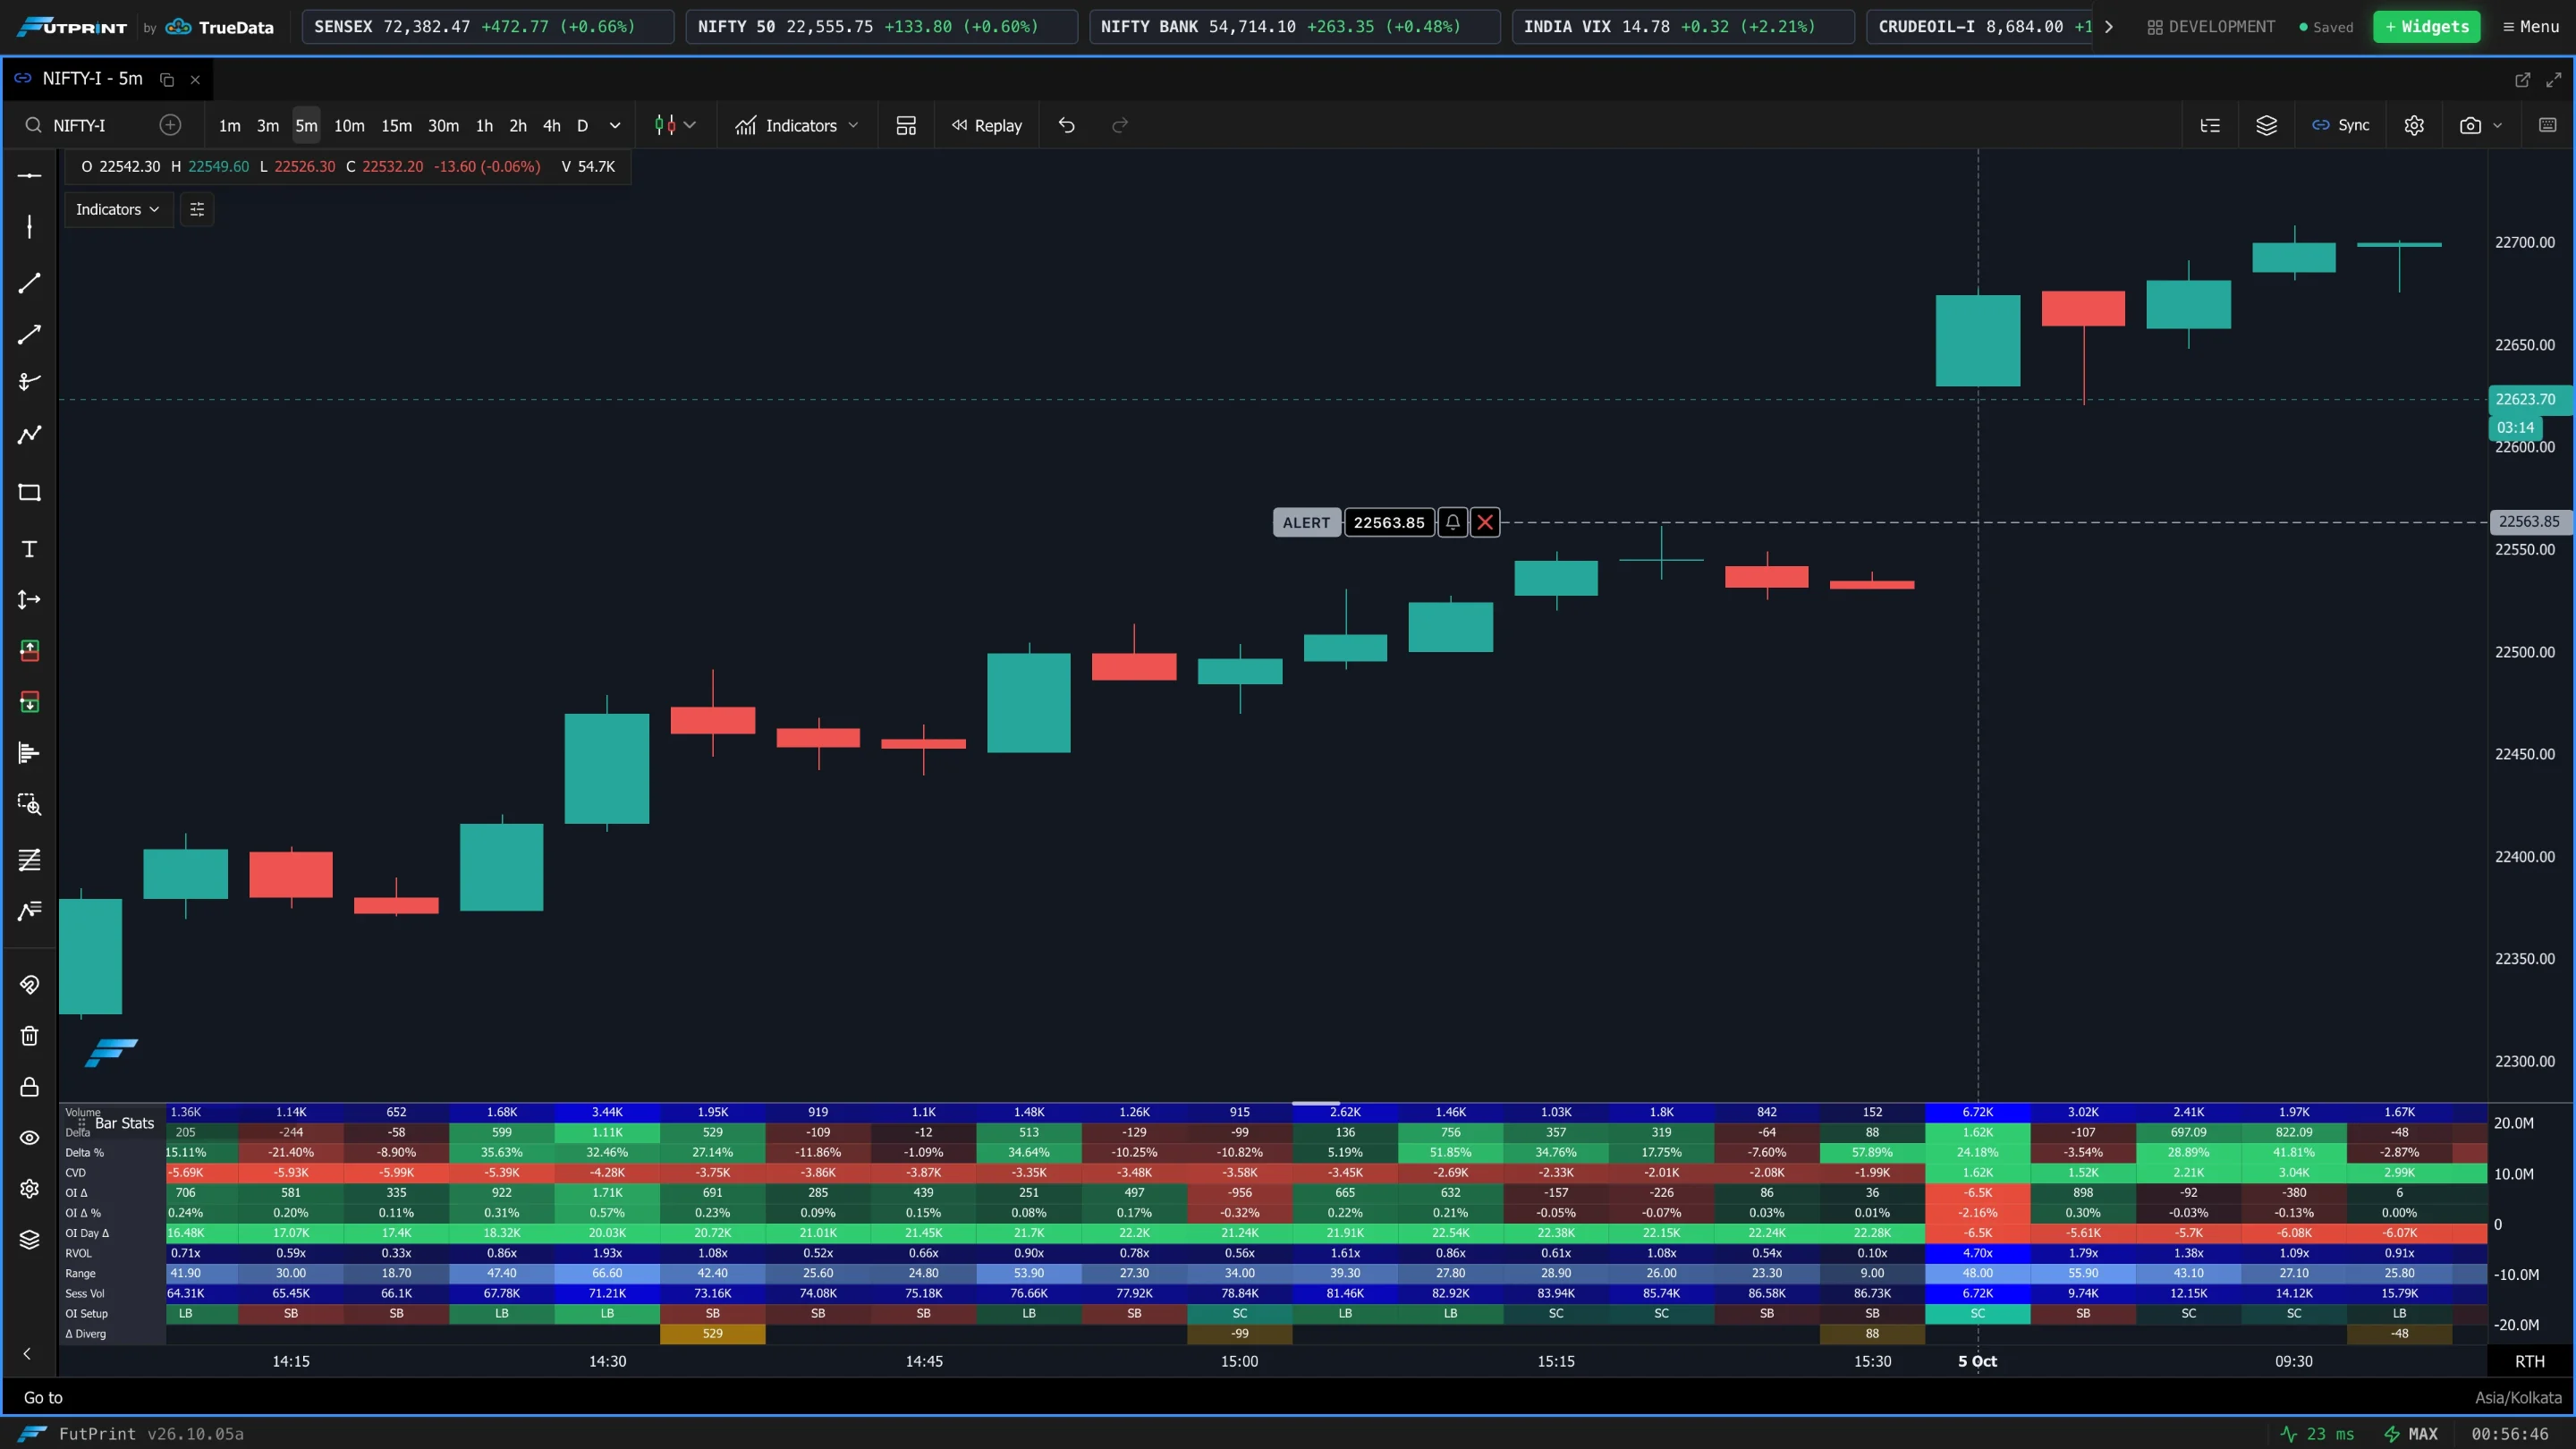
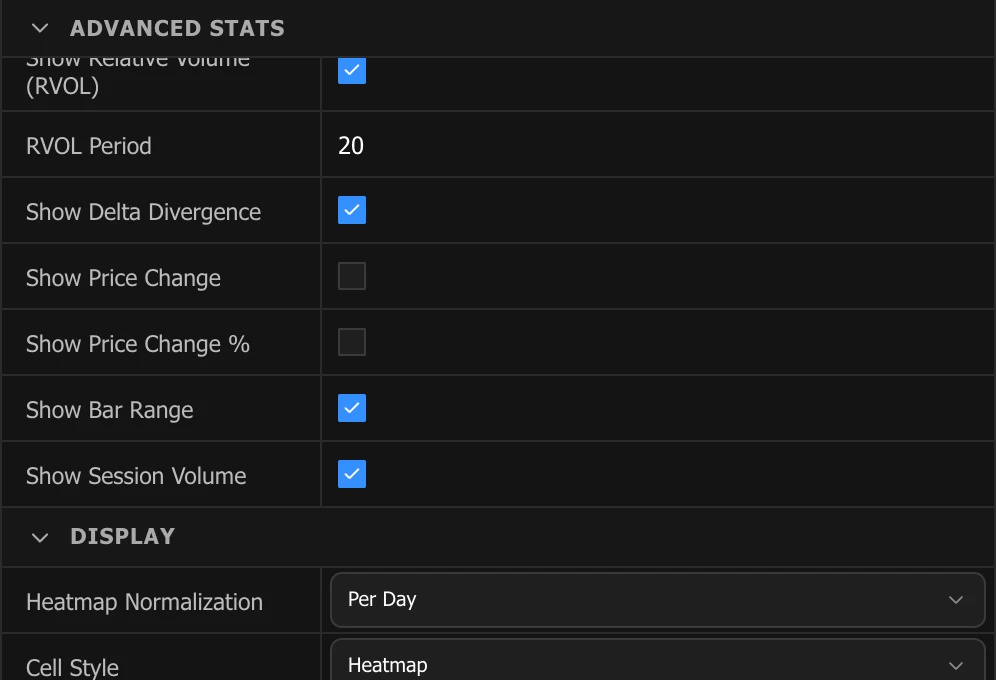
| Show Relative Volume (RVOL) | The candle's volume against the trailing average. RVOL Period sets the number of bars in that average. |
| Show Delta Divergence | Highlights bars where price and delta disagree. |
| Show Price Change / Show Price Change % | The candle's change in points and percent. |
| Show Bar Range | High minus low. |
| Show Session Volume | Cumulative volume for the session so far. |
Display
| Setting | What it does |
|---|---|
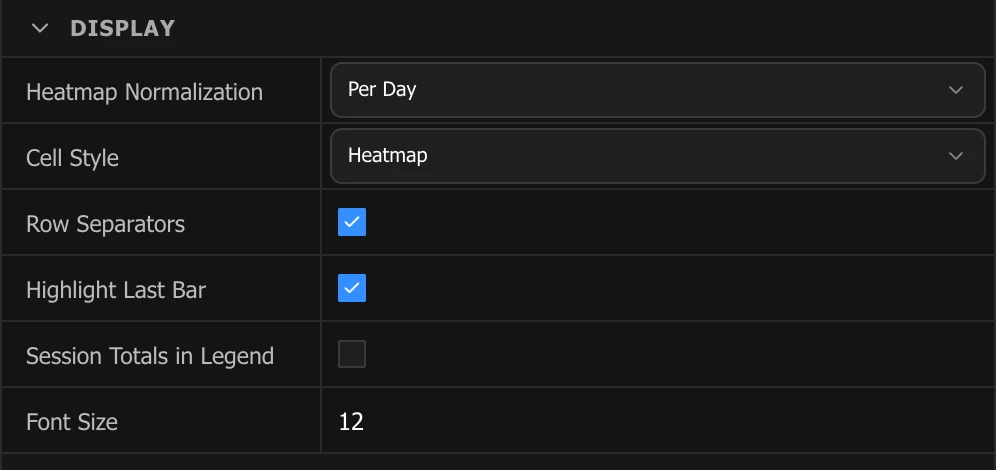
| Heatmap Normalization | The reference maximum used for cell intensity: Per Day or Visible Range. |
| Cell Style | Heatmap shades the whole cell; Bar draws a bar inside it. |
| Row Separators | Lines between rows. |
| Highlight Last Bar | Outlines the latest candle's column. |
| Session Totals in Legend | Shows the session totals in the pane legend. |
| Font Size | Preferred text size. It reduces automatically when bars or rows do not have enough room. |
Appearance
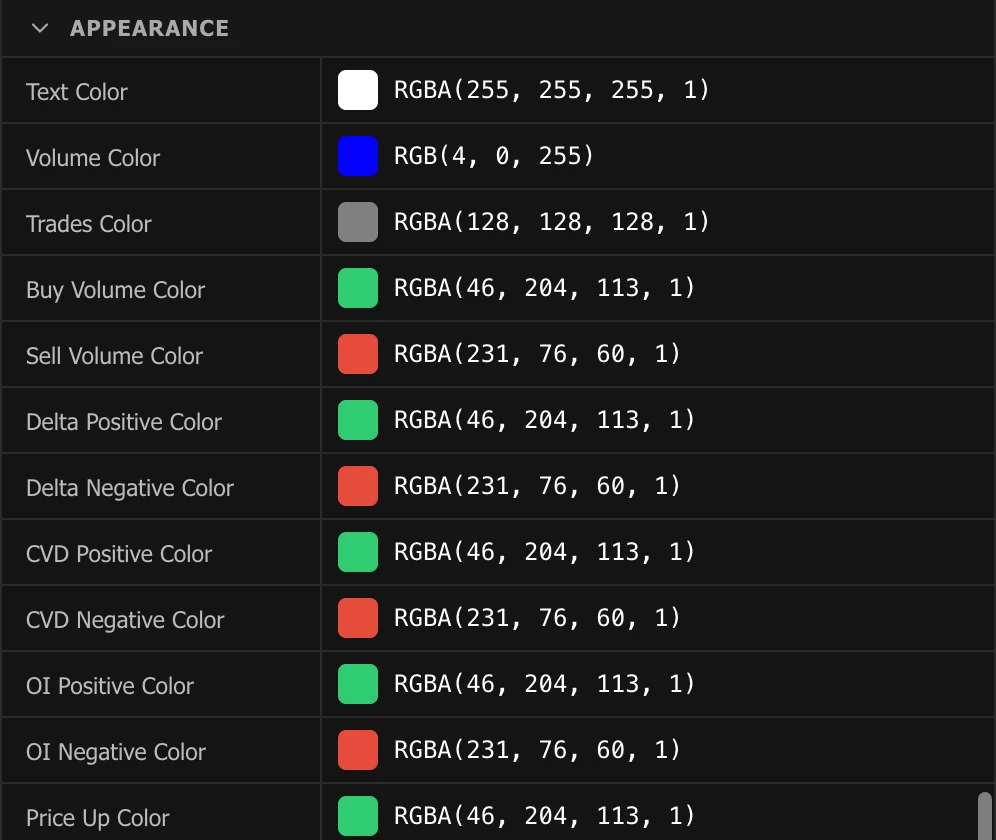
Colours for each kind of value: Text, Volume, Trades, Buy Volume, Sell Volume, positive and negative Delta, CVD and OI, Price Up and Price Down, Range, Divergence, and the four OI build-up labels.
Each row you add makes every row shorter. Keep to the handful you actually read — Volume, Delta, CVD and RVOL cover most order-flow work — and add OI rows on derivatives when positioning matters.